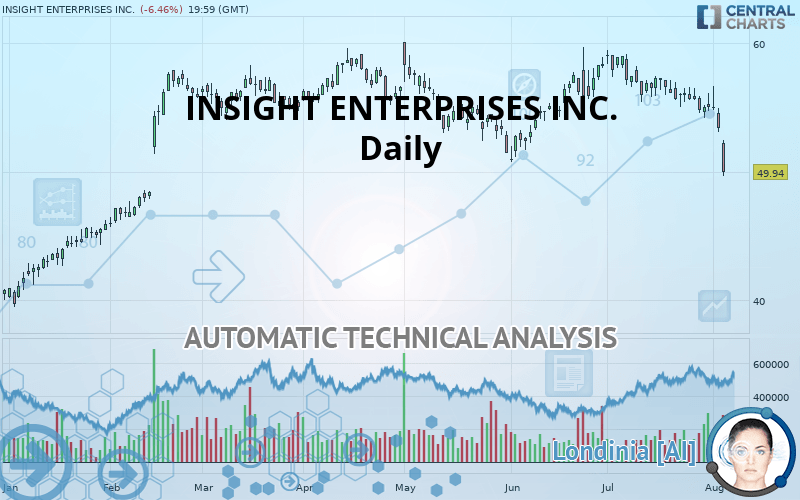
INSIGHT ENTERPRISES INC. - Daily - Technical analysis published on 08/06/2019 (GMT)
- Who voted?
- 313
- 0
Click here for a new analysis!
- Timeframe : Daily
- - Analysis generated on
- Status : INVALID

Summary of the analysis

Additional analysis
Quotes
The INSIGHT ENTERPRISES INC. price is 49.94 USD. On the day, this instrument lost -6.46% and was between 49.67 USD and 52.49 USD. This implies that the price is at +0.54% from its lowest and at -4.86% from its highest.The Central Gaps scanner detects the formation of a bearish gap marking the strong presence of sellers ahead of buyers at the opening. This formed a quotation gap.
Opening Gap DOWN
Type : Bearish
Timeframe : Openning
A study of price movements over other periods shows the following variations:
Technical
A technical analysis in Daily of this INSIGHT ENTERPRISES INC. chart shows a sharp bearish trend. 82.14% of the signals given by moving averages are bearish. This strongly bearish trend is supported by the strong bearish signals given by short-term moving averages. The Central Indicators market scanner is currently detecting several bearish signals that could impact this trend:
Bearish trend reversal : Moving Average 50
Type : Bearish
Timeframe : Daily
Bearish trend reversal : adaptative moving average 100
Type : Bearish
Timeframe : Daily
Moving Average bearish crossovers : AMA20 & AMA50
Type : Bearish
Timeframe : Daily
Bearish price crossover with adaptative moving average 100
Type : Bearish
Timeframe : Daily
In fact, according to the parameters integrated into the Central Analyzer system, 13 technical indicators out of 18 analysed are currently bearish. But beware of excesses. The Central Indicators scanner currently detects this:
CCI indicator is oversold : under -100
Type : Neutral
Timeframe : Daily
Williams %R indicator is oversold : under -80
Type : Neutral
Timeframe : Daily
Pivot points : price is under support 3
Type : Neutral
Timeframe : Daily
Pivot points : price is under support 3
Type : Neutral
Timeframe : Weekly
Parabolic SAR indicator bearish reversal
Type : Bearish
Timeframe : Daily
SuperTrend indicator bearish reversal
Type : Bearish
Timeframe : Daily
No signals are given by Central Patterns, a market scanner specialised in chart patterns, resistances and supports.
No result was found by the Central Candlesticks scanner on Japanese candlesticks.
| S3 | S2 | S1 | Price | R1 | R2 | R3 | |
|---|---|---|---|---|---|---|---|
| ProTrendLines | 43.36 | 45.70 | 47.71 | 49.94 | 50.97 | 53.33 | 56.23 |
| Change (%) | -13.18% | -8.49% | -4.47% | - | +2.06% | +6.79% | +12.60% |
| Change | -6.58 | -4.24 | -2.23 | - | +1.03 | +3.39 | +6.29 |
| Level | Minor | Intermediate | Major | - | Minor | Minor | Major |
Pivot points can also be used to set your price objectives. Here is the price situation in relation to pivot points:
| Pivot points | S3 | S2 | S1 | PP | R1 | R2 | R3 |
|---|---|---|---|---|---|---|---|
| Standard | 50.76 | 51.92 | 52.66 | 53.82 | 54.55 | 55.71 | 56.45 |
| Camarilla | 52.87 | 53.04 | 53.22 | 53.39 | 53.56 | 53.74 | 53.91 |
| Woodie | 50.55 | 51.81 | 52.44 | 53.71 | 54.34 | 55.60 | 56.23 |
| Fibonacci | 51.92 | 52.64 | 53.09 | 53.82 | 54.54 | 54.99 | 55.71 |
| Pivot points | S3 | S2 | S1 | PP | R1 | R2 | R3 |
|---|---|---|---|---|---|---|---|
| Standard | 48.45 | 50.76 | 52.08 | 54.39 | 55.71 | 58.02 | 59.34 |
| Camarilla | 52.39 | 52.72 | 53.06 | 53.39 | 53.72 | 54.06 | 54.39 |
| Woodie | 47.95 | 50.51 | 51.58 | 54.14 | 55.21 | 57.77 | 58.84 |
| Fibonacci | 50.76 | 52.15 | 53.01 | 54.39 | 55.78 | 56.64 | 58.02 |
| Pivot points | S3 | S2 | S1 | PP | R1 | R2 | R3 |
|---|---|---|---|---|---|---|---|
| Standard | 47.69 | 50.93 | 52.97 | 56.21 | 58.25 | 61.49 | 63.53 |
| Camarilla | 53.57 | 54.05 | 54.54 | 55.02 | 55.50 | 55.99 | 56.47 |
| Woodie | 47.10 | 50.63 | 52.38 | 55.91 | 57.66 | 61.19 | 62.94 |
| Fibonacci | 50.93 | 52.94 | 54.19 | 56.21 | 58.22 | 59.47 | 61.49 |
Numerical data
The following is the status of technical indicators and moving averages registered at the time this technical analysis was created:
| RSI (14): | 22.66 | |
| MACD (12,26,9): | -0.9000 | |
| Directional Movement: | -24.25 | |
| AROON (14): | -100.00 | |
| DEMA (21): | 54.25 | |
| Parabolic SAR (0,02-0,02-0,2): | 56.71 | |
| Elder Ray (13): | -3.51 | |
| Super Trend (3,10): | 55.87 | |
| Zig ZAG (10): | 49.94 | |
| VORTEX (21): | 0.7200 | |
| Stochastique (14,3,5): | 12.45 | |
| TEMA (21): | 53.24 | |
| Williams %R (14): | -96.51 | |
| Chande Momentum Oscillator (20): | -6.68 | |
| Repulse (5,40,3): | -9.5800 | |
| ROCnROLL: | 2 | |
| TRIX (15,9): | -0.0700 | |
| Courbe Coppock: | 10.29 |
| MA7: | 54.12 | |
| MA20: | 55.66 | |
| MA50: | 55.47 | |
| MA100: | 55.89 | |
| MAexp7: | 53.61 | |
| MAexp20: | 55.14 | |
| MAexp50: | 55.56 | |
| MAexp100: | 54.87 | |
| Price / MA7: | -7.72% | |
| Price / MA20: | -10.28% | |
| Price / MA50: | -9.97% | |
| Price / MA100: | -10.65% | |
| Price / MAexp7: | -6.85% | |
| Price / MAexp20: | -9.43% | |
| Price / MAexp50: | -10.12% | |
| Price / MAexp100: | -8.98% |
News
The last news published on INSIGHT ENTERPRISES INC. at the time of the generation of this analysis was as follows:
- Shareholder Alert: Ademi & O'Reilly, LLP Investigates whether PCM, Inc. has obtained a Fair Price in its sale to Insight Enterprises
- Insight Publishes First Corporate Citizenship Report
- Insight Enterprises, Inc. Reports Strong Fourth Quarter and Record Full Year 2018 Results
- Insight Canada Becomes a Microsoft CSP Indirect Provider
- Report: Exploring Fundamental Drivers Behind Manulife Financial, Baozun, AstraZeneca, Insight Enterprises, Albireo Pharma, and Mobile TeleSystems OJSC — New Horizons, Emerging Trends, and Upcoming Developments
About author

Online


Add a comment
Comments
0 comments on the analysis INSIGHT ENTERPRISES INC. - Daily