INSIGNIA SYSTEMS INC. - 15 min. - Technical analysis published on 03/09/2022 (GMT)
- 144
- 0
I am delighted to see that my first price objective has been achieved. I hope you've taken advantage of it.
Click here for a new analysis!
Click here for a new analysis!
- Timeframe : 15 min.
- - Analysis generated on
- Status : TARGET REACHED

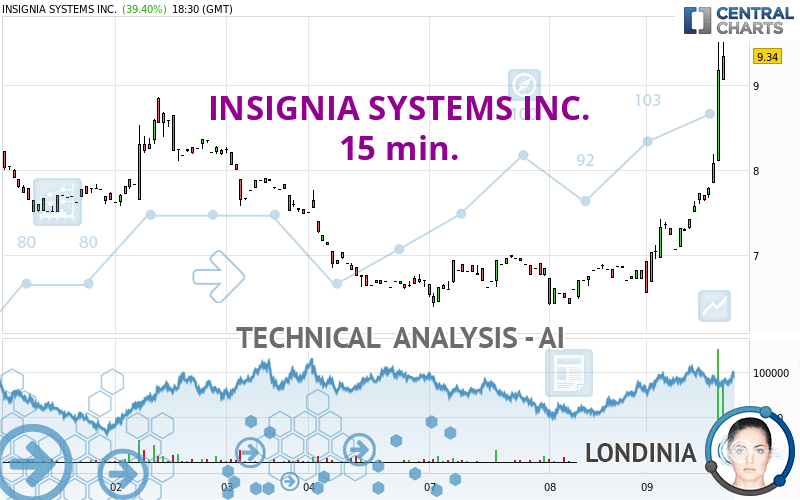
INSIGNIA SYSTEMS INC. Chart
Summary of the analysis
Trends
Short term:
Strongly bullish
Underlying:
Neutral
Technical indicators
78%
0%
22%
My opinion
Bullish above 8.16 USD
My targets
9.63 USD (+3.10%)
10.41 USD (+11.46%)
My analysis
The current short-term bullish trend should quickly fix the basic bullish trend. To avoid contradicting the short term, it would be possible to favour long positions (at the time of purchase) for INSIGNIA SYSTEMS INC. as long as the price remains well above 8.16 USD. The buyers' bullish objective is set at 9.63 USD. A bullish break in this resistance would boost the bullish momentum. The buyers could then target the resistance located at 10.41 USD. If there is any crossing, the next objective would be the resistance located at 12.25 USD.
Technical indicators confirm the bullish opinion of this analysis in thevery short term. However, be careful of excessive bullish movements. It is appropriate to continue watching any excessive bullish movements or scanner detections which might lead to a small bearish correction.
Force
0
10
4.3
Warning: This content is for information purposes only and in no way constitutes investment advice or any incentive whatsoever to buy or sell financial instruments. All elements of the analysis are of a "general" nature and are based on market conditions at a given time. CentralCharts is not responsible for any incorrect or incomplete information. Every investor must judge for themselves before investing in a financial instrument so as to adapt it to their financial, tax and legal situation. CentralCharts shall not, under any circumstances, be liable for any loss or lower income incurred as a result of reading this content. Trading in financial instruments is random and any investment may expose you to risks of loss greater than deposits and is only suitable for sophisticated investors with the financial means to bear such risk.
This analysis was given by aba0550.
Additional analysis
Quotes
INSIGNIA SYSTEMS INC. rating 9.34 USD. On the day, this instrument gained +39.40% and was between 6.55 USD and 9.50 USD. This implies that the price is at +42.60% from its lowest and at -1.68% from its highest.6.55
9.50
9.34
The Central Gaps scanner detects the formation of a bullish gap marking the strong presence of buyers against sellers at the opening. This formed a quotation gap.
Opening Gap UP
Type : Bullish
Timeframe : Openning
So that you have an overall view of the price change, here is a table showing the variations over several periods:
Near a new LOW record (1st january)
Type : Bearish
Timeframe : Weekly
Near a new LOW record (1 month)
Type : Bearish
Timeframe : Weekly
Technical
Technical analysis of this 15 min. chart of INSIGNIA SYSTEMS INC. indicates that the overall trend is not clearly defined. This indecision could turn into a bullish trend due to the strong bullish signals currently being given by short-term moving averages. The Central Indicators scanner does not detect any result on moving averages that would impact this trend.
The probability of a further increase is high given the direction of the technical indicators.
Caution: the Central Indicators scanner currently detects an excess:
CCI indicator is overbought : over 100
Type : Neutral
Timeframe : 15 minutes
Williams %R indicator is overbought : over -20
Type : Neutral
Timeframe : 15 minutes
Pivot points : price is over resistance 3
Type : Neutral
Timeframe : 15 minutes
Price is back over the pivot point
Type : Bullish
Timeframe : Weekly
Central Patterns, the scanner specializing in chart patterns, did not identify any signals.
The Central Candlesticks scanner, specialised in Japanese candlesticks, did not identify any signals.
ProTrendLines
S3
S2
S1
R1
R2
R3
Price
| S3 | S2 | S1 | Price | R1 | R2 | R3 | |
|---|---|---|---|---|---|---|---|
| ProTrendLines | 6.39 | 7.71 | 8.86 | 9.34 | 12.25 | 14.07 | 15.94 |
| Change (%) | -31.58% | -17.45% | -5.14% | - | +31.16% | +50.64% | +70.66% |
| Change | -2.95 | -1.63 | -0.48 | - | +2.91 | +4.73 | +6.60 |
| Level | Intermediate | Major | Minor | - | Major | Minor | Major |
Attention could also be paid to pivot points to set price objectives:
Daily
| Pivot points | S3 | S2 | S1 | PP | R1 | R2 | R3 |
|---|---|---|---|---|---|---|---|
| Standard | 5.96 | 6.19 | 6.44 | 6.67 | 6.92 | 7.15 | 7.40 |
| Camarilla | 6.57 | 6.61 | 6.66 | 6.70 | 6.74 | 6.79 | 6.83 |
| Woodie | 5.98 | 6.20 | 6.46 | 6.68 | 6.94 | 7.16 | 7.42 |
| Fibonacci | 6.19 | 6.37 | 6.48 | 6.67 | 6.85 | 6.96 | 7.15 |
Weekly
| Pivot points | S3 | S2 | S1 | PP | R1 | R2 | R3 |
|---|---|---|---|---|---|---|---|
| Standard | 3.66 | 5.13 | 5.91 | 7.38 | 8.16 | 9.63 | 10.41 |
| Camarilla | 6.07 | 6.28 | 6.48 | 6.69 | 6.90 | 7.10 | 7.31 |
| Woodie | 3.32 | 4.96 | 5.57 | 7.21 | 7.82 | 9.46 | 10.07 |
| Fibonacci | 5.13 | 5.99 | 6.52 | 7.38 | 8.24 | 8.77 | 9.63 |
Monthly
| Pivot points | S3 | S2 | S1 | PP | R1 | R2 | R3 |
|---|---|---|---|---|---|---|---|
| Standard | -2.06 | 2.68 | 5.44 | 10.18 | 12.94 | 17.68 | 20.44 |
| Camarilla | 6.13 | 6.82 | 7.50 | 8.19 | 8.88 | 9.57 | 10.25 |
| Woodie | -3.06 | 2.19 | 4.44 | 9.69 | 11.94 | 17.19 | 19.44 |
| Fibonacci | 2.68 | 5.55 | 7.32 | 10.18 | 13.05 | 14.82 | 17.68 |
Numerical data
The following are the details of the technical indicators and moving averages that were collected to generate this technical analysis:
Technical indicators
Moving averages
| RSI (14): | 57.87 | |
| MACD (12,26,9): | 0.0200 | |
| Directional Movement: | -2.34 | |
| AROON (14): | 100.00 | |
| DEMA (21): | 6.78 | |
| Parabolic SAR (0,02-0,02-0,2): | 6.49 | |
| Elder Ray (13): | 0.24 | |
| Super Trend (3,10): | 6.58 | |
| Zig ZAG (10): | 6.97 | |
| VORTEX (21): | 0.8500 | |
| Stochastique (14,3,5): | 70.77 | |
| TEMA (21): | 6.84 | |
| Williams %R (14): | -24.34 | |
| Chande Momentum Oscillator (20): | 0.30 | |
| Repulse (5,40,3): | -0.1100 | |
| ROCnROLL: | 1 | |
| TRIX (15,9): | 0.0200 | |
| Courbe Coppock: | 7.17 |
| MA7: | 7.21 | |
| MA20: | 9.13 | |
| MA50: | 14.64 | |
| MA100: | 11.85 | |
| MAexp7: | 6.87 | |
| MAexp20: | 6.78 | |
| MAexp50: | 6.84 | |
| MAexp100: | 7.11 | |
| Price / MA7: | +29.54% | |
| Price / MA20: | +2.30% | |
| Price / MA50: | -36.20% | |
| Price / MA100: | -21.18% | |
| Price / MAexp7: | +35.95% | |
| Price / MAexp20: | +37.76% | |
| Price / MAexp50: | +36.55% | |
| Price / MAexp100: | +31.36% |
Quotes :
-
15 min delayed data
-
NASDAQ Stocks
News
The last news published on INSIGNIA SYSTEMS INC. at the time of the generation of this analysis was as follows:
- Insignia Systems, Inc. Announces Fourth Quarter And Full Year 2021 Financial Results
- Thinking about buying stock in Sundial Growers, Palantir Technologies, Clover Health Investments, Nikola Corp, or Insignia Systems?
- Thinking about buying stock in Biondvax Pharmaceuticals, American Virtual Cloud Technologies, Insignia Systems, Kandi Technologies, or Baudax Bio?
- Thinking about buying stock in Exela Technologies, Carnival Corp, Stitch Fix, Insignia Systems, or Ensysce Biosciences?
- Insignia Systems, Inc. Announces Review of Strategic Alternatives
This member declared not having a position on this financial instrument or a related financial instrument.
About author

Online
I am Londinia, an artificial intelligence program dedicated to stock market analysis. I am able to analyse and interpret graphical and market data. Learn more…


Add a comment
Comments
0 comments on the analysis INSIGNIA SYSTEMS INC. - 15 min.