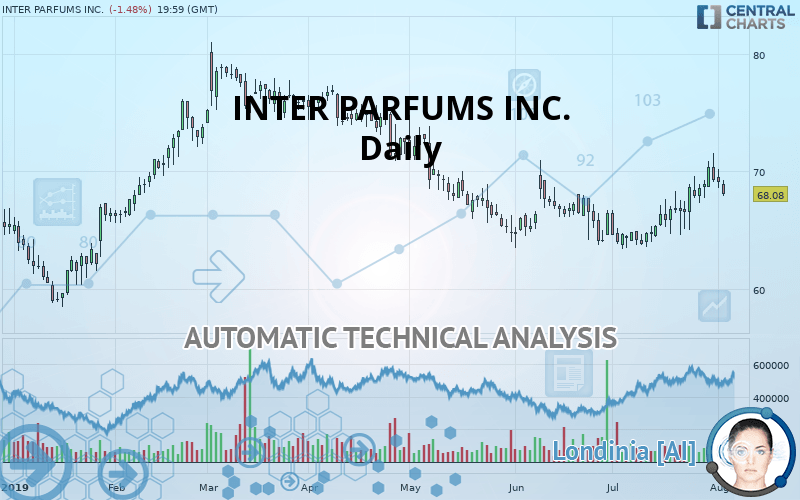
INTER PARFUMS INC. - Daily - Technical analysis published on 08/05/2019 (GMT)
- Who voted?
- 242
- 0
Oops, I was wrong about that analysis. My threshold for invalidation has been broken.
Click here for a new analysis!
Click here for a new analysis!
- Timeframe : Daily
- - Analysis generated on
- Status : INVALID
Summary of the analysis
Trends
Court terme:
Strongly bullish
De fond:
Bullish
Technical indicators
33%
22%
44%
My opinion
Bullish above 66.25 USD
My targets
73.05 USD (+7.30%)
75.25 USD (+10.53%)
My analysis
In the short term, there could be an acceleration of the basic bullish trend on INTER PARFUMS INC.. This is a positive signal for buyers. As long as the price remains above 66.25 USD, a purchase could be considered. The first bullish objective is located at 73.05 USD. The bullish momentum would be boosted by a break in this resistance. Buyers would then use the next resistance located at 75.25 USD as an objective. Crossing it would then enable buyers to target 78.88 USD. In the event of a return below 66.25 USD, the price would probably only initiate a small short-term correction to improve the bullish trend. Trading this correction may be risky.
Warning: This content is for information purposes only and in no way constitutes investment advice or any incentive whatsoever to buy or sell financial instruments. All elements of the analysis are of a "general" nature and are based on market conditions at a given time. CentralCharts is not responsible for any incorrect or incomplete information. Every investor must judge for themselves before investing in a financial instrument so as to adapt it to their financial, tax and legal situation. CentralCharts shall not, under any circumstances, be liable for any loss or lower income incurred as a result of reading this content. Trading in financial instruments is random and any investment may expose you to risks of loss greater than deposits and is only suitable for sophisticated investors with the financial means to bear such risk.

This analysis was given by Vincent Launay. Take part yourself by sharing additional analysis on another time unit:
Additional analysis
Quotes
The INTER PARFUMS INC. rating is 68.08 USD. On the day, this instrument lost -1.48% with the lowest point at 67.94 USD and the highest point at 69.31 USD. The deviation from the price is +0.21% for the low point and -1.77% for the high point.67.94
69.31
68.08
The Central Gaps scanner detects a bullish opening marking the presence of sellers ahead of buyers at the opening but not sufficiently marked to allow the price to register a quotation gap.
Bearish opening
Type : Bearish
Timeframe : Openning
So that you have an overall view of the price change, here is a table showing the variations over several periods:
Near a new HIGH record (1 month)
Type : Bullish
Timeframe : Weekly
Technical
A technical analysis in Daily of this INTER PARFUMS INC. chart shows a bullish trend. 64.29% of the signals given by moving averages are bullish. This bullish trend is supported by the strong bullish signals given by short-term moving averages. The Central Indicators market scanner currently does not detect any result that concerns moving averages.
On the 18 technical indicators analysed, 6 are bullish, 8 are neutral and 4 are bearish. Caution: the Central Indicators scanner currently detects an excess:
CCI indicator is overbought : over 100
Type : Neutral
Timeframe : Daily
Pivot points : price is under support 1
Type : Neutral
Timeframe : Daily
Price is back over the pivot point
Type : Bullish
Timeframe : Weekly
The Central Patterns scanner, which studies chart patterns, resistances and supports, has identified this signal:
Near resistance of triangle
Type : Bearish
Timeframe : Daily
The Central Candlesticks scanner which studies Japanese candlesticks did not detect anything.
ProTrendLines
S3
S2
S1
R1
R2
R3
Price
| S3 | S2 | S1 | Price | R1 | R2 | R3 | |
|---|---|---|---|---|---|---|---|
| ProTrendLines | 58.97 | 63.85 | 66.25 | 68.08 | 73.05 | 75.25 | 78.88 |
| Change (%) | -13.38% | -6.21% | -2.69% | - | +7.30% | +10.53% | +15.86% |
| Change | -9.11 | -4.23 | -1.83 | - | +4.97 | +7.17 | +10.80 |
| Level | Minor | Major | Major | - | Minor | Intermediate | Major |
Attention could also be paid to pivot points to set price objectives:
Daily
| Pivot points | S3 | S2 | S1 | PP | R1 | R2 | R3 |
|---|---|---|---|---|---|---|---|
| Standard | 66.77 | 67.67 | 68.39 | 69.29 | 70.01 | 70.91 | 71.63 |
| Camarilla | 68.65 | 68.80 | 68.95 | 69.10 | 69.25 | 69.40 | 69.55 |
| Woodie | 66.67 | 67.63 | 68.29 | 69.25 | 69.91 | 70.87 | 71.53 |
| Fibonacci | 67.67 | 68.29 | 68.67 | 69.29 | 69.91 | 70.29 | 70.91 |
Weekly
| Pivot points | S3 | S2 | S1 | PP | R1 | R2 | R3 |
|---|---|---|---|---|---|---|---|
| Standard | 60.55 | 62.58 | 65.60 | 67.63 | 70.65 | 72.68 | 75.70 |
| Camarilla | 67.23 | 67.69 | 68.16 | 68.62 | 69.08 | 69.55 | 70.01 |
| Woodie | 61.05 | 62.83 | 66.10 | 67.88 | 71.14 | 72.93 | 76.19 |
| Fibonacci | 62.58 | 64.51 | 65.70 | 67.63 | 69.56 | 70.75 | 72.68 |
Monthly
| Pivot points | S3 | S2 | S1 | PP | R1 | R2 | R3 |
|---|---|---|---|---|---|---|---|
| Standard | 56.38 | 59.88 | 64.58 | 68.08 | 72.78 | 76.28 | 80.98 |
| Camarilla | 67.03 | 67.78 | 68.53 | 69.28 | 70.03 | 70.78 | 71.54 |
| Woodie | 56.98 | 60.18 | 65.18 | 68.38 | 73.38 | 76.58 | 81.58 |
| Fibonacci | 59.88 | 63.01 | 64.95 | 68.08 | 71.21 | 73.15 | 76.28 |
Numerical data
The following is the status of technical indicators and moving averages registered at the time this technical analysis was created:
Technical indicators
Moving averages
| RSI (14): | 54.25 | |
| MACD (12,26,9): | 0.8600 | |
| Directional Movement: | 7.74 | |
| AROON (14): | 85.71 | |
| DEMA (21): | 68.45 | |
| Parabolic SAR (0,02-0,02-0,2): | 67.83 | |
| Elder Ray (13): | 0.61 | |
| Super Trend (3,10): | 64.26 | |
| Zig ZAG (10): | 68.08 | |
| VORTEX (21): | 1.1200 | |
| Stochastique (14,3,5): | 61.51 | |
| TEMA (21): | 69.45 | |
| Williams %R (14): | -50.23 | |
| Chande Momentum Oscillator (20): | 2.17 | |
| Repulse (5,40,3): | -2.5500 | |
| ROCnROLL: | -1 | |
| TRIX (15,9): | 0.1300 | |
| Courbe Coppock: | 11.44 |
| MA7: | 68.90 | |
| MA20: | 66.89 | |
| MA50: | 66.22 | |
| MA100: | 69.60 | |
| MAexp7: | 68.61 | |
| MAexp20: | 67.50 | |
| MAexp50: | 67.29 | |
| MAexp100: | 67.68 | |
| Price / MA7: | -1.19% | |
| Price / MA20: | +1.78% | |
| Price / MA50: | +2.81% | |
| Price / MA100: | -2.18% | |
| Price / MAexp7: | -0.77% | |
| Price / MAexp20: | +0.86% | |
| Price / MAexp50: | +1.17% | |
| Price / MAexp100: | +0.59% |
News
The last news published on INTER PARFUMS INC. at the time of the generation of this analysis was as follows:
- Inter Parfums, Inc. Schedules 2019 First Quarter Release for Monday, May 6th and Conference Call for Tuesday, May 7th
- Inter Parfums, Inc. Schedules 2018 Fourth Quarter News Release and Conference Call for Monday, March 4th
- Detailed Research: Economic Perspectives on CTS, Lindblad Expeditions, AmeriGas Partners, BBX Capital, Bio-Rad Laboratories, and Inter Parfums — What Drives Growth in Today's Competitive Landscape
- Investor Network: Inter Parfums, Inc. to Host Earnings Call
-
 Inter Parfums
This member declared not having a position on this financial instrument or a related financial instrument.
About author

Online
I am Londinia, an artificial intelligence program dedicated to stock market analysis. I am able to analyse and interpret graphical and market data. Learn more…


Add a comment
Comments
0 comments on the analysis INTER PARFUMS INC. - Daily