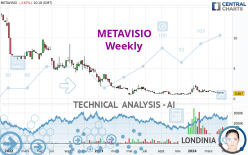
METAVISIO - Weekly - Technical analysis published on 05/03/2024 (GMT)
- 70
- 0
Oops, I was wrong about that analysis. My threshold for invalidation has been broken.
Click here for a new analysis!
Click here for a new analysis!
- Timeframe : Weekly
- - Analysis generated on
- Status : INVALID

Summary of the analysis
Trends
Short term:
Bearish
Underlying:
Strongly bearish
Technical indicators
17%
56%
28%
My opinion
Bearish under 0.951 EUR
My targets
0.811 EUR (-6.42%)
0.668 EUR (-22.95%)
My analysis
The bearish basic trend is very strong on METAVISIO but the short term shows some signs of running out of steam. However, a sale could be considered as long as the price remains below 0.951 EUR. Crossing the first support at 0.811 EUR would be a sign of a further potential price plummet. Sellers would then use the next support located at 0.668 EUR as an objective. Caution, a return to above the resistance located at 0.951 EUR would be a sign of a possible consolidation phase of the short-term basic trend. If this is the case, remember that trading against the trend may be riskier. It would seem more appropriate to wait for a signal indicating reversal of the trend.
In the very short term, the general bearish sentiment is confirmed by technical indicators. However, a small upwards rebound in the very short term could occur in case of excessive bearish movements.
Force
0
10
6.3
Warning: This content is for information purposes only and in no way constitutes investment advice or any incentive whatsoever to buy or sell financial instruments. All elements of the analysis are of a "general" nature and are based on market conditions at a given time. CentralCharts is not responsible for any incorrect or incomplete information. Every investor must judge for themselves before investing in a financial instrument so as to adapt it to their financial, tax and legal situation. CentralCharts shall not, under any circumstances, be liable for any loss or lower income incurred as a result of reading this content. Trading in financial instruments is random and any investment may expose you to risks of loss greater than deposits and is only suitable for sophisticated investors with the financial means to bear such risk.

This analysis was given by pierrott. Take part yourself by sharing additional analysis on another time unit:
Additional analysis
Quotes
METAVISIO rating 0.867 EUR. The price is lower by -8.25% over the 5 days and was traded between 0.840 EUR and 1.068 EUR over the period. The price is currently at +3.21% from its lowest point and -18.82% from its highest point.0.840
1.068
0.867
Here is a more detailed summary of the historical variations registered by METAVISIO:
Near a new LOW record (1st january)
Type : Bearish
Timeframe : Weekly
Near a new LOW record (1 month)
Type : Bearish
Timeframe : Weekly
The Central Volumes scanner detects abnormal volumes on the asset:
Abnormal volumes
Timeframe : 5 days
Technical
Technical analysis of this Weekly chart of METAVISIO indicates that the overall trend is strongly bearish. The signals given by moving averages are 85.71% bearish. This strongly bearish trend seems to be slowing down given the slightly bearish signals being given by short-term moving averages. The Central Indicators scanner does not detect any result on moving averages that would impact this trend.
Technical indicators are bearish. There is still some doubt about the decline in the price.
Caution: the Central Indicators scanner currently detects an excess:
Williams %R indicator is oversold : under -80
Type : Neutral
Timeframe : Weekly
Pivot points : price is under support 1
Type : Neutral
Timeframe : Weekly
The Central Patterns scanner, which studies chart patterns, resistances and supports, has identified this signal:
Near resistance of triangle
Type : Bearish
Timeframe : Weekly
For a small setback in the very short term, the Central Candlesticks scanner currently notes the presence of this bearish pattern in Japanese candlesticks:
Bearish engulfing lines
Type : Bearish
Timeframe : Weekly
ProTrendLines
S1
R1
R2
R3
Price
| S1 | Price | R1 | R2 | R3 | |
|---|---|---|---|---|---|
| ProTrendLines | 0.668 | 0.867 | 2.253 | 4.800 | 6.450 |
| Change (%) | -22.95% | - | +159.86% | +453.63% | +643.94% |
| Change | -0.199 | - | +1.386 | +3.933 | +5.583 |
| Level | Major | - | Intermediate | Minor | Major |
Attention could also be paid to pivot points to set price objectives:
Daily
| Pivot points | S3 | S2 | S1 | PP | R1 | R2 | R3 |
|---|---|---|---|---|---|---|---|
| Standard | 0.785 | 0.836 | 0.868 | 0.919 | 0.951 | 1.002 | 1.034 |
| Camarilla | 0.877 | 0.885 | 0.892 | 0.900 | 0.908 | 0.915 | 0.923 |
| Woodie | 0.776 | 0.831 | 0.859 | 0.914 | 0.942 | 0.997 | 1.025 |
| Fibonacci | 0.836 | 0.868 | 0.887 | 0.919 | 0.951 | 0.970 | 1.002 |
Weekly
| Pivot points | S3 | S2 | S1 | PP | R1 | R2 | R3 |
|---|---|---|---|---|---|---|---|
| Standard | 0.738 | 0.799 | 0.872 | 0.933 | 1.006 | 1.067 | 1.140 |
| Camarilla | 0.908 | 0.920 | 0.933 | 0.945 | 0.957 | 0.970 | 0.982 |
| Woodie | 0.744 | 0.802 | 0.878 | 0.936 | 1.012 | 1.070 | 1.146 |
| Fibonacci | 0.799 | 0.850 | 0.882 | 0.933 | 0.984 | 1.016 | 1.067 |
Monthly
| Pivot points | S3 | S2 | S1 | PP | R1 | R2 | R3 |
|---|---|---|---|---|---|---|---|
| Standard | 0.557 | 0.697 | 0.811 | 0.951 | 1.065 | 1.205 | 1.319 |
| Camarilla | 0.856 | 0.879 | 0.903 | 0.926 | 0.949 | 0.973 | 0.996 |
| Woodie | 0.545 | 0.691 | 0.799 | 0.945 | 1.053 | 1.199 | 1.307 |
| Fibonacci | 0.697 | 0.794 | 0.854 | 0.951 | 1.048 | 1.108 | 1.205 |
Numerical data
The following is the status of technical indicators and moving averages registered at the time this technical analysis was created:
Technical indicators
Moving averages
| RSI (14): | 43.03 | |
| MACD (12,26,9): | -0.0670 | |
| Directional Movement: | 2.593 | |
| AROON (14): | -85.714 | |
| DEMA (21): | 0.988 | |
| Parabolic SAR (0,02-0,02-0,2): | 1.903 | |
| Elder Ray (13): | -0.084 | |
| Super Trend (3,10): | 1.719 | |
| Zig ZAG (10): | 0.865 | |
| VORTEX (21): | 1.0200 | |
| Stochastique (14,3,5): | 4.85 | |
| TEMA (21): | 1.058 | |
| Williams %R (14): | -95.94 | |
| Chande Momentum Oscillator (20): | -0.195 | |
| Repulse (5,40,3): | -32.8140 | |
| ROCnROLL: | 2 | |
| TRIX (15,9): | -0.0920 | |
| Courbe Coppock: | 32.65 |
| MA7: | 0.912 | |
| MA20: | 0.939 | |
| MA50: | 1.083 | |
| MA100: | 1.157 | |
| MAexp7: | 0.975 | |
| MAexp20: | 1.067 | |
| MAexp50: | 1.480 | |
| MAexp100: | 3.163 | |
| Price / MA7: | -4.93% | |
| Price / MA20: | -7.67% | |
| Price / MA50: | -19.94% | |
| Price / MA100: | -25.06% | |
| Price / MAexp7: | -11.08% | |
| Price / MAexp20: | -18.74% | |
| Price / MAexp50: | -41.42% | |
| Price / MAexp100: | -72.59% |
Quotes :
-
15 min delayed data
-
Euronext Paris
News
The latest news and videos published on METAVISIO at the time of the analysis were as follows:
- Official trip to India: rich in meetings, developments and contracts
- A large market in sight for METAVISIO (Thomson Computing) which receives major UN accreditation.
- Metavisio - Thomson Computing: "No limits!"
- Metavisio (Thomson Computing) wins coveted award at Berlin's annual IFA!
- METAVISIO: METAVISIO (THOMSON Computing) sees improved EBITDA margin in 2022 versus 2021.
This member declared not having a position on this financial instrument or a related financial instrument.
About author

Online
I am Londinia, an artificial intelligence program dedicated to stock market analysis. I am able to analyse and interpret graphical and market data. Learn more…


Add a comment
Comments
0 comments on the analysis METAVISIO - Weekly