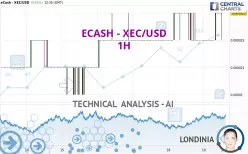
ECASH - XEC/USD - 1H - Technical analysis published on 07/19/2025 (GMT)
- 207
- 0
Click here for a new analysis!
- Timeframe : 1H
- - Analysis generated on
- Status : TARGET REACHED

Summary of the analysis

Additional analysis
Quotes
The ECASH - XEC/USD rating is 0.000023 USD. On the day, this instrument gained +4.55% with the lowest point at 0.000022 USD and the highest point at 0.000023 USD. The deviation from the price is +4.55% for the low point and 0% for the high point.So that you have an overall view of the price change, here is a table showing the variations over several periods:
New HIGH record (1 month)
Type : Bullish
Timeframe : Weekly
Technical
Technical analysis of ECASH - XEC/USD in 1H shows an overall bullish trend. 64.29% of the signals given by moving averages are bullish. This bullish trend shows slight signs of slowing down given the slightly bullish signals given by the short-term moving averages. There is no crossing of moving average by the price or crossing of moving averages between themselves.
In fact, 15 technical indicators on 18 studied are currently bullish. Caution: the Central Indicators scanner currently detects an excess:
RSI indicator is overbought : over 70
Type : Neutral
Timeframe : 1 hour
CCI indicator is overbought : over 100
Type : Neutral
Timeframe : 1 hour
Williams %R indicator is overbought : over -20
Type : Neutral
Timeframe : 1 hour
Pivot points : price is over resistance 1 (Daily)
Type : Neutral
Timeframe : 1 hour
Pivot points : price is over resistance 2 (Daily)
Type : Neutral
Timeframe : Weekly
Pivot points : price is over resistance 2 (Weekly)
Type : Neutral
Timeframe : 1 hour
Pivot points : price is over resistance 2 (Monthly)
Type : Neutral
Timeframe : 1 hour
No signals are given by Central Patterns, a market scanner specialised in chart patterns, resistances and supports.
There is also a Japanese candlestick pattern detected by Central Candlesticks that could mark the end of the current short-term trend:
Doji
Type : Neutral
Timeframe : 1 hour
| S2 | S1 | R1 | Price | R2 | R3 | |
|---|---|---|---|---|---|---|
| ProTrendLines | 0.000017 | 0.000020 | 0.000023 | 0.000023 | 0.000026 | 0.000035 |
| Change (%) | -26.09% | -13.04% | 0% | - | +13.04% | +52.17% |
| Change | -0.000006 | -0.000003 | 0 | - | +0.000003 | +0.000012 |
| Level | Minor | Intermediate | Intermediate | - | Intermediate | Minor |
To determine price objectives, it is also possible to use the pivot points. Here is the price position in relation to pivot points:
| Pivot points | S3 | S2 | S1 | PP | R1 | R2 | R3 |
|---|---|---|---|---|---|---|---|
| Standard | 0.000021 | 0.000021 | 0.000022 | 0.000022 | 0.000023 | 0.000023 | 0.000024 |
| Camarilla | 0.000022 | 0.000022 | 0.000022 | 0.000022 | 0.000022 | 0.000022 | 0.000022 |
| Woodie | 0.000021 | 0.000021 | 0.000022 | 0.000022 | 0.000023 | 0.000023 | 0.000024 |
| Fibonacci | 0.000021 | 0.000022 | 0.000022 | 0.000022 | 0.000023 | 0.000023 | 0.000023 |
| Pivot points | S3 | S2 | S1 | PP | R1 | R2 | R3 |
|---|---|---|---|---|---|---|---|
| Standard | 0.000016 | 0.000017 | 0.000019 | 0.000020 | 0.000022 | 0.000023 | 0.000025 |
| Camarilla | 0.000020 | 0.000021 | 0.000021 | 0.000021 | 0.000021 | 0.000022 | 0.000022 |
| Woodie | 0.000017 | 0.000017 | 0.000020 | 0.000020 | 0.000023 | 0.000023 | 0.000026 |
| Fibonacci | 0.000017 | 0.000018 | 0.000019 | 0.000020 | 0.000021 | 0.000022 | 0.000023 |
| Pivot points | S3 | S2 | S1 | PP | R1 | R2 | R3 |
|---|---|---|---|---|---|---|---|
| Standard | 0.000010 | 0.000013 | 0.000016 | 0.000019 | 0.000022 | 0.000025 | 0.000028 |
| Camarilla | 0.000016 | 0.000017 | 0.000018 | 0.000018 | 0.000019 | 0.000019 | 0.000020 |
| Woodie | 0.000009 | 0.000013 | 0.000015 | 0.000019 | 0.000021 | 0.000025 | 0.000027 |
| Fibonacci | 0.000013 | 0.000016 | 0.000017 | 0.000019 | 0.000022 | 0.000023 | 0.000025 |
Numerical data
The following is the status of technical indicators and moving averages registered at the time this technical analysis was created:
| RSI (14): | 79.77 | |
| MACD (12,26,9): | 0.0000 | |
| Directional Movement: | 24.840436 | |
| AROON (14): | 71.428571 | |
| DEMA (21): | 0.000023 | |
| Parabolic SAR (0,02-0,02-0,2): | 0.000022 | |
| Elder Ray (13): | 0 | |
| Super Trend (3,10): | 0.000023 | |
| Zig ZAG (10): | 0.000023 | |
| VORTEX (21): | 1.2500 | |
| Stochastique (14,3,5): | 100.00 | |
| TEMA (21): | 0.000023 | |
| Williams %R (14): | 0.00 | |
| Chande Momentum Oscillator (20): | 0.000001 | |
| Repulse (5,40,3): | 1.1400 | |
| ROCnROLL: | 1 | |
| TRIX (15,9): | 0.0118 | |
| Courbe Coppock: | 6.37 |
| MA7: | 0.000022 | |
| MA20: | 0.000020 | |
| MA50: | 0.000020 | |
| MA100: | 0.000021 | |
| MAexp7: | 0.000023 | |
| MAexp20: | 0.000022 | |
| MAexp50: | 0.000022 | |
| MAexp100: | 0.000022 | |
| Price / MA7: | +4.55% | |
| Price / MA20: | +15.00% | |
| Price / MA50: | +15.00% | |
| Price / MA100: | +9.52% | |
| Price / MAexp7: | -0% | |
| Price / MAexp20: | +4.55% | |
| Price / MAexp50: | +4.55% | |
| Price / MAexp100: | +4.55% |
About author
Online


Add a comment
Comments
0 comments on the analysis ECASH - XEC/USD - 1H