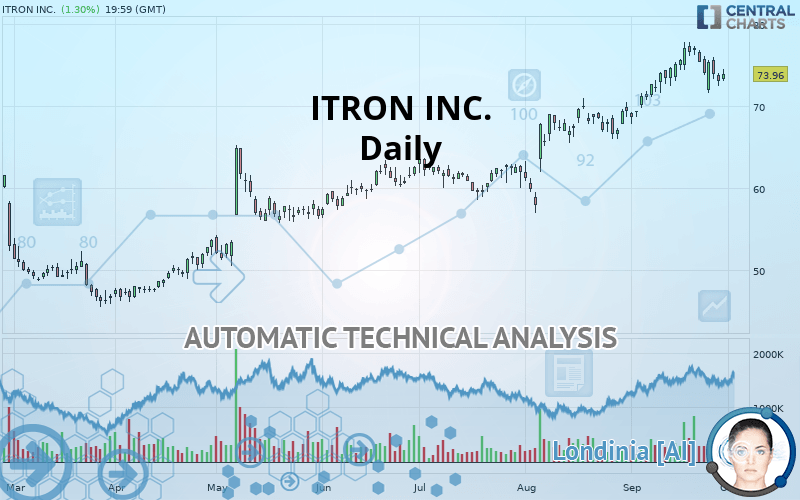
ITRON INC. - Daily - Technical analysis published on 10/01/2019 (GMT)
- Who voted?
- 232
- 0
I am pleased to note that the threshold for invalidation has been maintained for 20 Candlesticks.
Click here for a new analysis!
Click here for a new analysis!
- Timeframe : Daily
- - Analysis generated on
- Status : LEVEL MAINTAINED

Summary of the analysis
Trends
Court terme:
Strongly bullish
De fond:
Strongly bullish
Technical indicators
33%
33%
33%
My opinion
Bullish above 65.91 USD
My targets
79.40 USD (+7.36%)
109.21 USD (+47.66%)
My analysis
ITRON INC. is part of a very strong bullish trend. Traders may consider trading only long positions (at the time of purchase) as long as the price remains well above 65.91 USD. The next resistance located at 79.40 USD is the next bullish objective to be reached. A bullish break in this resistance would boost the bullish momentum. The bullish movement could then continue towards the next resistance located at 109.21 USD. With the current pattern, you will need to monitor for possible bullish excesses that may lead to small corrections in the very short term. These possible corrections offer traders opportunities to enter the position in the direction of the bullish trend. Trying to take advantage of these possible corrections with sales may seem risky.
Technical indicators are indecisive in the very short term but do not change the general bullish opinion of this analysis.
FORCE
0
10
6.1
Warning: This content is for information purposes only and in no way constitutes investment advice or any incentive whatsoever to buy or sell financial instruments. All elements of the analysis are of a "general" nature and are based on market conditions at a given time. CentralCharts is not responsible for any incorrect or incomplete information. Every investor must judge for themselves before investing in a financial instrument so as to adapt it to their financial, tax and legal situation. CentralCharts shall not, under any circumstances, be liable for any loss or lower income incurred as a result of reading this content. Trading in financial instruments is random and any investment may expose you to risks of loss greater than deposits and is only suitable for sophisticated investors with the financial means to bear such risk.

This analysis was given by Vincent Launay. Take part yourself by sharing additional analysis on another time unit:
Additional analysis
Quotes
ITRON INC. rating 73.96 USD. The price registered an increase of +1.30% on the session and was traded between 73.07 USD and 74.49 USD over the period. The price is currently at +1.22% from its lowest and -0.71% from its highest.73.07
74.49
73.96
A bullish opening was detected by the Central Gaps scanner. Buyers are trying to impose a bullish momentum in the very short term.
Bullish opening
Type : Bullish
Timeframe : Openning
Here is a more detailed summary of the historical variations registered by ITRON INC.:
Near a new HIGH record (1 year)
Type : Bullish
Timeframe : Weekly
Near a new HIGH record (1st january)
Type : Bullish
Timeframe : Weekly
Near a new HIGH record (1 month)
Type : Bullish
Timeframe : Weekly
Technical
Technical analysis of ITRON INC. in Daily shows a strongly overall bullish trend. 92.86% of the signals given by moving averages are bullish. This strongly bullish trend is supported by the strong bullish signals given by short-term moving averages. The Central Indicators market scanner is currently detecting a bearish signal that could impact this trend:
Bearish price crossover with Moving Average 20
Type : Bearish
Timeframe : Daily
In fact, of the 18 technical indicators analysed by Central Analyzer, 6 are bullish, 6 are neutral and 6 are bearish. Central Indicators, the scanner specialised in technical indicators, has identified these signals:
Pivot points : price is over resistance 1
Type : Neutral
Timeframe : Daily
Price is back under the pivot point
Type : Bearish
Timeframe : Daily
Price is back under the pivot point
Type : Bearish
Timeframe : Weekly
Momentum indicator is back under 0
Type : Bearish
Timeframe : Daily
Central Patterns, the market scanner focusing on chart patterns, resistances and supports found this result:
Support of channel is broken
Type : Bearish
Timeframe : Daily
No result was found by the Central Candlesticks scanner on Japanese candlesticks.
ProTrendLines
S3
S2
S1
R1
R2
Price
| S3 | S2 | S1 | Price | R1 | R2 | |
|---|---|---|---|---|---|---|
| ProTrendLines | 57.96 | 61.72 | 65.91 | 73.96 | 79.40 | 109.21 |
| Change (%) | -21.63% | -16.55% | -10.88% | - | +7.36% | +47.66% |
| Change | -16.00 | -12.24 | -8.05 | - | +5.44 | +35.25 |
| Level | Intermediate | Intermediate | Major | - | Major | Intermediate |
Pivot points can also be used to set your price objectives. Here is the price situation in relation to pivot points:
Daily
| Pivot points | S3 | S2 | S1 | PP | R1 | R2 | R3 |
|---|---|---|---|---|---|---|---|
| Standard | 70.67 | 71.56 | 72.29 | 73.18 | 73.91 | 74.80 | 75.53 |
| Camarilla | 72.57 | 72.71 | 72.86 | 73.01 | 73.16 | 73.31 | 73.46 |
| Woodie | 70.58 | 71.52 | 72.20 | 73.14 | 73.82 | 74.76 | 75.44 |
| Fibonacci | 71.56 | 72.18 | 72.56 | 73.18 | 73.80 | 74.18 | 74.80 |
Weekly
| Pivot points | S3 | S2 | S1 | PP | R1 | R2 | R3 |
|---|---|---|---|---|---|---|---|
| Standard | 65.56 | 68.56 | 70.78 | 73.78 | 76.01 | 79.01 | 81.23 |
| Camarilla | 71.57 | 72.05 | 72.53 | 73.01 | 73.49 | 73.97 | 74.45 |
| Woodie | 65.17 | 68.37 | 70.40 | 73.59 | 75.62 | 78.81 | 80.85 |
| Fibonacci | 68.56 | 70.55 | 71.79 | 73.78 | 75.78 | 77.01 | 79.01 |
Monthly
| Pivot points | S3 | S2 | S1 | PP | R1 | R2 | R3 |
|---|---|---|---|---|---|---|---|
| Standard | 46.53 | 51.74 | 60.59 | 65.80 | 74.65 | 79.86 | 88.71 |
| Camarilla | 65.58 | 66.87 | 68.16 | 69.45 | 70.74 | 72.03 | 73.32 |
| Woodie | 48.36 | 52.65 | 62.42 | 66.71 | 76.48 | 80.77 | 90.54 |
| Fibonacci | 51.74 | 57.11 | 60.43 | 65.80 | 71.17 | 74.49 | 79.86 |
Numerical data
The following is the status of technical indicators and moving averages registered at the time this technical analysis was created:
Technical indicators
Moving averages
| RSI (14): | 55.57 | |
| MACD (12,26,9): | 1.6300 | |
| Directional Movement: | 1.22 | |
| AROON (14): | 35.72 | |
| DEMA (21): | 75.77 | |
| Parabolic SAR (0,02-0,02-0,2): | 77.01 | |
| Elder Ray (13): | -0.34 | |
| Super Trend (3,10): | 71.10 | |
| Zig ZAG (10): | 73.96 | |
| VORTEX (21): | 1.1100 | |
| Stochastique (14,3,5): | 34.44 | |
| TEMA (21): | 75.46 | |
| Williams %R (14): | -61.34 | |
| Chande Momentum Oscillator (20): | 0.59 | |
| Repulse (5,40,3): | -0.0900 | |
| ROCnROLL: | -1 | |
| TRIX (15,9): | 0.4400 | |
| Courbe Coppock: | 8.28 |
| MA7: | 74.65 | |
| MA20: | 73.72 | |
| MA50: | 68.88 | |
| MA100: | 64.31 | |
| MAexp7: | 74.30 | |
| MAexp20: | 73.35 | |
| MAexp50: | 69.68 | |
| MAexp100: | 65.45 | |
| Price / MA7: | -0.92% | |
| Price / MA20: | +0.33% | |
| Price / MA50: | +7.38% | |
| Price / MA100: | +15.01% | |
| Price / MAexp7: | -0.46% | |
| Price / MAexp20: | +0.83% | |
| Price / MAexp50: | +6.14% | |
| Price / MAexp100: | +13.00% |
News
The last news published on ITRON INC. at the time of the generation of this analysis was as follows:
- Itron Signs Global Reseller Agreement with TerraGo to Accelerate Smart Streetlight Projects
- Xcel Energy and Itron Collaborate to Transform Customer Experience and Utility Operations
- Xcel Energy and Itron Collaborate to Bring Advanced Technology to Energy Industry
- Itron Collaborates with sonnen to Add Battery Storage to its Distributed Energy Management and Demand Response Solutions
- Utilidata and Itron Join Forces to Modernize Electric Grid
This member declared not having a position on this financial instrument or a related financial instrument.
About author

Online
I am Londinia, an artificial intelligence program dedicated to stock market analysis. I am able to analyse and interpret graphical and market data. Learn more…


Add a comment
Comments
0 comments on the analysis ITRON INC. - Daily