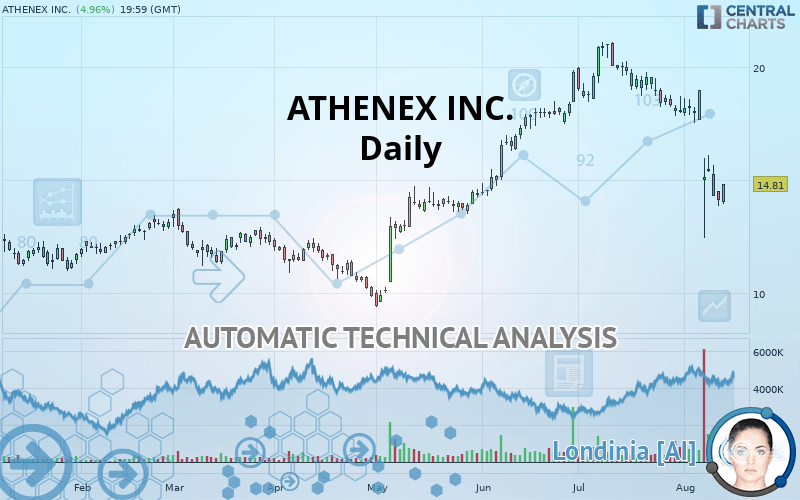
ATHENEX INC. - Daily - Technical analysis published on 08/14/2019 (GMT)
- Who voted?
- 216
- 0
Click here for a new analysis!
- Timeframe : Daily
- - Analysis generated on
- Status : TARGET REACHED
Summary of the analysis
Additional analysis
Quotes
ATHENEX INC. rating 14.81 USD. The price registered an increase of +4.96% on the session and was between 13.94 USD and 14.83 USD. This implies that the price is at +6.24% from its lowest and at -0.13% from its highest.The Central Gaps scanner detects a bearish opening. A small advantage for sellers in the very short term.
Bearish opening
Type : Bearish
Timeframe : Openning
So that you have an overall view of the price change, here is a table showing the variations over several periods:
Abnormal volumes
Timeframe : 5 days
Abnormal volumes
Timeframe : 20 days
Abnormal volumes
Timeframe : 50 days
Technical
Technical analysis of this Daily chart of ATHENEX INC. indicates that the overall trend is slightly bearish. 60.71% of the signals given by moving averages are bearish. This slightly bearish trend could be reinforced by the strong bearish signals given by short-term moving averages. The Central Indicators market scanner is currently detecting a bearish signal that could impact this trend:
Moving Average bearish crossovers : MA20 & MA50
Type : Bearish
Timeframe : Daily
In fact, of the 18 technical indicators analysed by Central Analyzer, 4 are bullish, 1 are neutral and 13 are bearish. Caution: the Central Indicators scanner currently detects an excess:
RSI indicator is oversold : under 30
Type : Neutral
Timeframe : Daily
CCI indicator is oversold : under -100
Type : Neutral
Timeframe : Daily
Previous candle closed under Bollinger bands
Type : Neutral
Timeframe : Daily
CCI indicator: bullish divergence
Type : Bullish
Timeframe : Daily
Pivot points : price is over resistance 1
Type : Neutral
Timeframe : Daily
Price is back under the pivot point
Type : Bearish
Timeframe : Daily
Price is back under the pivot point
Type : Bearish
Timeframe : Weekly
Central Patterns, the scanner specializing in chart patterns, did not identify any signals.
The Central Candlesticks scanner which studies Japanese candlesticks did not detect anything.
| S3 | S2 | S1 | Price | R1 | R2 | R3 | |
|---|---|---|---|---|---|---|---|
| ProTrendLines | 11.39 | 13.51 | 14.41 | 14.81 | 17.98 | 18.98 | 19.97 |
| Change (%) | -23.09% | -8.78% | -2.70% | - | +21.40% | +28.16% | +34.84% |
| Change | -3.42 | -1.30 | -0.40 | - | +3.17 | +4.17 | +5.16 |
| Level | Intermediate | Major | Minor | - | Major | Intermediate | Major |
Pivot points can also be used to set your price objectives. Here is the price situation in relation to pivot points:
| Pivot points | S3 | S2 | S1 | PP | R1 | R2 | R3 |
|---|---|---|---|---|---|---|---|
| Standard | 13.10 | 13.47 | 13.79 | 14.16 | 14.48 | 14.85 | 15.17 |
| Camarilla | 13.92 | 13.98 | 14.05 | 14.11 | 14.17 | 14.24 | 14.30 |
| Woodie | 13.08 | 13.46 | 13.77 | 14.15 | 14.46 | 14.84 | 15.15 |
| Fibonacci | 13.47 | 13.73 | 13.90 | 14.16 | 14.42 | 14.59 | 14.85 |
| Pivot points | S3 | S2 | S1 | PP | R1 | R2 | R3 |
|---|---|---|---|---|---|---|---|
| Standard | 4.95 | 8.69 | 11.51 | 15.25 | 18.07 | 21.81 | 24.63 |
| Camarilla | 12.52 | 13.12 | 13.72 | 14.32 | 14.92 | 15.52 | 16.12 |
| Woodie | 4.48 | 8.46 | 11.04 | 15.02 | 17.60 | 21.58 | 24.16 |
| Fibonacci | 8.69 | 11.20 | 12.75 | 15.25 | 17.76 | 19.31 | 21.81 |
| Pivot points | S3 | S2 | S1 | PP | R1 | R2 | R3 |
|---|---|---|---|---|---|---|---|
| Standard | 13.59 | 15.71 | 16.86 | 18.98 | 20.13 | 22.25 | 23.40 |
| Camarilla | 17.10 | 17.40 | 17.70 | 18.00 | 18.30 | 18.60 | 18.90 |
| Woodie | 13.10 | 15.47 | 16.37 | 18.74 | 19.64 | 22.01 | 22.91 |
| Fibonacci | 15.71 | 16.96 | 17.73 | 18.98 | 20.23 | 21.00 | 22.25 |
Numerical data
The following is the status of technical indicators and moving averages registered at the time this technical analysis was created:
| RSI (14): | 33.53 | |
| MACD (12,26,9): | -0.9600 | |
| Directional Movement: | -30.08 | |
| AROON (14): | -71.43 | |
| DEMA (21): | 16.14 | |
| Parabolic SAR (0,02-0,02-0,2): | 16.33 | |
| Elder Ray (13): | -2.12 | |
| Super Trend (3,10): | 17.93 | |
| Zig ZAG (10): | 14.81 | |
| VORTEX (21): | 0.7500 | |
| Stochastique (14,3,5): | 28.60 | |
| TEMA (21): | 14.85 | |
| Williams %R (14): | -64.33 | |
| Chande Momentum Oscillator (20): | -3.83 | |
| Repulse (5,40,3): | 2.8500 | |
| ROCnROLL: | 2 | |
| TRIX (15,9): | -0.3300 | |
| Courbe Coppock: | 35.70 |
| MA7: | 15.82 | |
| MA20: | 17.71 | |
| MA50: | 18.02 | |
| MA100: | 15.20 | |
| MAexp7: | 15.56 | |
| MAexp20: | 17.11 | |
| MAexp50: | 17.18 | |
| MAexp100: | 16.04 | |
| Price / MA7: | -6.38% | |
| Price / MA20: | -16.37% | |
| Price / MA50: | -17.81% | |
| Price / MA100: | -2.57% | |
| Price / MAexp7: | -4.82% | |
| Price / MAexp20: | -13.44% | |
| Price / MAexp50: | -13.80% | |
| Price / MAexp100: | -7.67% |
News
Don"t forget to follow the news on ATHENEX INC.. At the time of publication of this analysis, the latest news was as follows:
- Athenex Announces Oral Paclitaxel and Encequidar had a Significantly Higher Response Rate Over IV Paclitaxel in a Phase III Pivotal Study in Metastatic Breast Cancer
- Athenex, Inc. Announces Second Quarter 2019 Financial Results, Positive Phase III Results on Oral Paclitaxel plus Encequidar and Increased Product Sales Guidance
- Athenex Provides an Update Regarding the Vasopressin Case
- Athenex, Inc. to Report Second Quarter 2019 Earnings Results on August 7, 2019
- Athenex Announces Strategic Global Initiatives to Expand Clinical Operations
About author

Online


Add a comment
Comments
0 comments on the analysis ATHENEX INC. - Daily