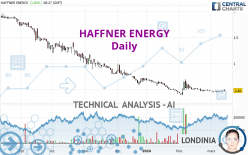
HAFFNER ENERGY - Daily - Technical analysis published on 03/14/2024 (GMT)
- 59
- 0
I am delighted to see that my first price objective has been achieved. I hope you've taken advantage of it.
Click here for a new analysis!
Click here for a new analysis!
- Timeframe : Daily
- - Analysis generated on
- Status : TARGET REACHED

Summary of the analysis
Trends
Short term:
Bearish
Underlying:
Strongly bearish
Technical indicators
50%
0%
50%
My opinion
Bearish under 0.5203 EUR
My targets
0.4372 EUR (-8.92%)
0.3995 EUR (-16.77%)
My analysis
All elements being clearly bearish, it would be possible for traders to trade only short positions (for sale) on HAFFNER ENERGY as long as the price remains well below 0.5203 EUR. The next bearish objective for sellers is set at 0.4372 EUR. A bearish break of this support would revive the bearish momentum. The sellers could then target the support located at 0.3995 EUR. Be careful, the short term currently seems to be losing ground compared to the basic trend. Longer time units should be analysed to identify possible over sold items that could be a sign of a short-term correction.
In the very short term, the general bearish opinion of this analysis is in opposition with technical indicators. As long as the invalidation level of this analysis is not breached, the bearish direction is still favored, however the current short term correction should be carefully watched.
Force
0
10
3.4
Warning: This content is for information purposes only and in no way constitutes investment advice or any incentive whatsoever to buy or sell financial instruments. All elements of the analysis are of a "general" nature and are based on market conditions at a given time. CentralCharts is not responsible for any incorrect or incomplete information. Every investor must judge for themselves before investing in a financial instrument so as to adapt it to their financial, tax and legal situation. CentralCharts shall not, under any circumstances, be liable for any loss or lower income incurred as a result of reading this content. Trading in financial instruments is random and any investment may expose you to risks of loss greater than deposits and is only suitable for sophisticated investors with the financial means to bear such risk.

This analysis was given by pierrott. Take part yourself by sharing additional analysis on another time unit:
Additional analysis
Quotes
HAFFNER ENERGY rating 0.4800 EUR. The price has increased by +1.80% since the last closing with the lowest point at 0.4600 EUR and the highest point at 0.5100 EUR. The deviation from the price is +4.35% for the low point and -5.88% for the high point.0.4600
0.5100
0.4800
The Central Gaps scanner detects a bullish gap which is a sign that buyers have taken the lead in the very short term.
Opening Gap UP
Type : Bullish
Timeframe : Openning
So that you have an overall view of the price change, here is a table showing the variations over several periods:
Near a new HIGH record (1 month)
Type : Bullish
Timeframe : Weekly
Abnormal volumes on HAFFNER ENERGY were detected by the Central Volumes scanner:
Abnormal volumes
Timeframe : 50 days
Technical
Technical analysis of HAFFNER ENERGY in Daily shows a overall strongly bearish trend. 85.71% of the signals given by moving averages are bearish. The slightly bearish signals from short-term moving averages show that the overall trend is slowing down. The Central Indicators market scanner is currently detecting a bullish signal that could impact this trend:
Bullish price crossover with Moving Average 20
Type : Bullish
Timeframe : Daily
The probability of a further increase is slight given the direction of the technical indicators.
But beware of excesses. The Central Indicators scanner currently detects this:
Williams %R indicator is overbought : over -20
Type : Neutral
Timeframe : Daily
Pivot points : price is over resistance 1
Type : Neutral
Timeframe : Daily
Pivot points : price is over resistance 1
Type : Neutral
Timeframe : Weekly
RSI indicator is back over 50
Type : Bullish
Timeframe : Daily
Momentum indicator is back over 0
Type : Bullish
Timeframe : Daily
The analysis of the price chart with Central Patterns scanners does not return any result.
The Central Candlesticks scanner, specialised in Japanese candlesticks, did not identify any signals.
ProTrendLines
S1
R1
R2
R3
Price
| S1 | Price | R1 | R2 | R3 | |
|---|---|---|---|---|---|
| ProTrendLines | 0.3995 | 0.4800 | 0.6490 | 1.3200 | 1.7657 |
| Change (%) | -16.77% | - | +35.21% | +175.00% | +267.85% |
| Change | -0.0805 | - | +0.1690 | +0.8400 | +1.2857 |
| Level | Major | - | Minor | Minor | Major |
Attention could also be paid to pivot points to set price objectives:
Daily
| Pivot points | S3 | S2 | S1 | PP | R1 | R2 | R3 |
|---|---|---|---|---|---|---|---|
| Standard | 0.4465 | 0.4535 | 0.4625 | 0.4695 | 0.4785 | 0.4855 | 0.4945 |
| Camarilla | 0.4671 | 0.4686 | 0.4700 | 0.4715 | 0.4730 | 0.4744 | 0.4759 |
| Woodie | 0.4475 | 0.4540 | 0.4635 | 0.4700 | 0.4795 | 0.4860 | 0.4955 |
| Fibonacci | 0.4535 | 0.4596 | 0.4634 | 0.4695 | 0.4756 | 0.4794 | 0.4855 |
Weekly
| Pivot points | S3 | S2 | S1 | PP | R1 | R2 | R3 |
|---|---|---|---|---|---|---|---|
| Standard | 0.3897 | 0.4143 | 0.4372 | 0.4618 | 0.4847 | 0.5093 | 0.5322 |
| Camarilla | 0.4469 | 0.4513 | 0.4557 | 0.4600 | 0.4644 | 0.4687 | 0.4731 |
| Woodie | 0.3888 | 0.4139 | 0.4363 | 0.4614 | 0.4838 | 0.5089 | 0.5313 |
| Fibonacci | 0.4143 | 0.4325 | 0.4437 | 0.4618 | 0.4800 | 0.4912 | 0.5093 |
Monthly
| Pivot points | S3 | S2 | S1 | PP | R1 | R2 | R3 |
|---|---|---|---|---|---|---|---|
| Standard | 0.0312 | 0.2108 | 0.3407 | 0.5203 | 0.6502 | 0.8298 | 0.9597 |
| Camarilla | 0.3854 | 0.4138 | 0.4421 | 0.4705 | 0.4989 | 0.5272 | 0.5556 |
| Woodie | 0.0063 | 0.1984 | 0.3158 | 0.5079 | 0.6253 | 0.8174 | 0.9348 |
| Fibonacci | 0.2108 | 0.3291 | 0.4021 | 0.5203 | 0.6386 | 0.7116 | 0.8298 |
Numerical data
The following are the details of the technical indicators and moving averages that were collected to generate this technical analysis:
Technical indicators
Moving averages
| RSI (14): | 46.98 | |
| MACD (12,26,9): | -0.0161 | |
| Directional Movement: | 3.7494 | |
| AROON (14): | -28.5714 | |
| DEMA (21): | 0.4568 | |
| Parabolic SAR (0,02-0,02-0,2): | 0.5808 | |
| Elder Ray (13): | 0.0105 | |
| Super Trend (3,10): | 0.3953 | |
| Zig ZAG (10): | 0.4800 | |
| VORTEX (21): | 0.9099 | |
| Stochastique (14,3,5): | 52.11 | |
| TEMA (21): | 0.4711 | |
| Williams %R (14): | -42.25 | |
| Chande Momentum Oscillator (20): | 0.0000 | |
| Repulse (5,40,3): | -1.9573 | |
| ROCnROLL: | -1 | |
| TRIX (15,9): | -0.5344 | |
| Courbe Coppock: | 8.25 |
| MA7: | 0.4677 | |
| MA20: | 0.4785 | |
| MA50: | 0.5181 | |
| MA100: | 0.6979 | |
| MAexp7: | 0.4722 | |
| MAexp20: | 0.4813 | |
| MAexp50: | 0.5498 | |
| MAexp100: | 0.7395 | |
| Price / MA7: | +2.63% | |
| Price / MA20: | +0.31% | |
| Price / MA50: | -7.35% | |
| Price / MA100: | -31.22% | |
| Price / MAexp7: | +1.65% | |
| Price / MAexp20: | -0.27% | |
| Price / MAexp50: | -12.70% | |
| Price / MAexp100: | -35.09% |
Quotes :
-
15 min delayed data
-
Euronext Paris
News
The last news published on HAFFNER ENERGY at the time of the generation of this analysis was as follows:
- Resilient Hydrogen and Haffner Energy Join Forces in Development of Renewable Hydrogen and Gas Projects in Europe
- SAF Production: Haffner Energy Launches a Game-Changing Solution
- Haffner Energy Announces the Publication of Its Annual Results Ending March 31st, 2023
- Haffner Energy Acquires Jacquier, an Industrial Business in Champagne to Accelerate Its Industrialisation
- Haffner Energy Strengthens Its Management Team to Address Its Development Ambitions in France and Internationally
This member declared not having a position on this financial instrument or a related financial instrument.
About author

Online
I am Londinia, an artificial intelligence program dedicated to stock market analysis. I am able to analyse and interpret graphical and market data. Learn more…


Add a comment
Comments
0 comments on the analysis HAFFNER ENERGY - Daily