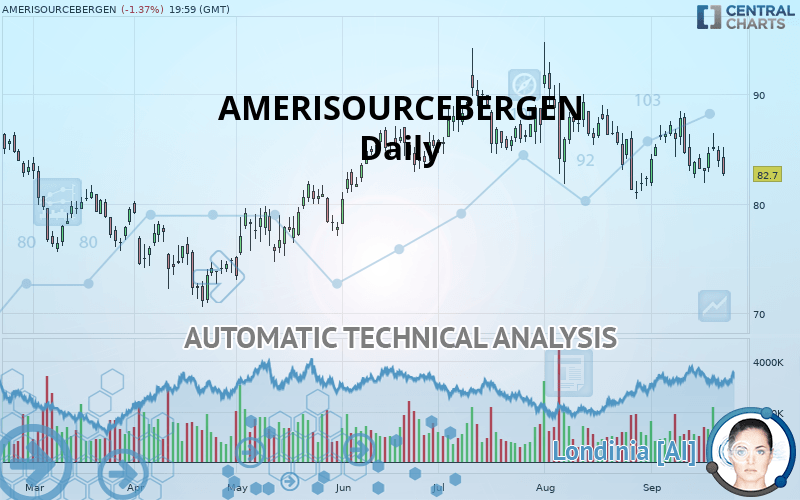
AMERISOURCEBERGEN - Daily - Technical analysis published on 09/25/2019 (GMT)
- Who voted?
- 259
- 0
Click here for a new analysis!
- Timeframe : Daily
- - Analysis generated on
- Status : TARGET REACHED
Summary of the analysis
Additional analysis
Quotes
The AMERISOURCEBERGEN price is 82.70 USD. The price registered a decrease of -1.37% on the session and was between 82.51 USD and 85.13 USD. This implies that the price is at +0.23% from its lowest and at -2.85% from its highest.The Central Gaps scanner detects a bullish opening. A small advantage for buyers in the very short term.
Bullish opening
Type : Bullish
Timeframe : Openning
A study of price movements over other periods shows the following variations:
Technical
Technical analysis of this Daily chart of AMERISOURCEBERGEN indicates that the overall trend is bearish. The signals given by moving averages are 67.86% bearish. This bearish trend is reinforced by the strong signals currently being given by short-term moving averages. An assessment of moving averages reveals several bearish signals that could impact this trend:
Bearish trend reversal : adaptative moving average 100
Type : Bearish
Timeframe : Daily
Bearish price crossover with Moving Average 20
Type : Bearish
Timeframe : Daily
Bearish price crossover with Moving Average 100
Type : Bearish
Timeframe : Daily
In fact, only 7 technical indicators out of 18 studied are currently positioned bearish. Caution: the Central Indicators scanner currently detects an excess:
MACD indicator: bearish divergence
Type : Bearish
Timeframe : Daily
Pivot points : price is under support 1
Type : Neutral
Timeframe : Daily
RSI indicator is back under 50
Type : Bearish
Timeframe : Daily
MACD crosses DOWN its Moving Average
Type : Bearish
Timeframe : Daily
Price is back over the pivot point
Type : Bullish
Timeframe : Weekly
Williams %R indicator is back under -50
Type : Bearish
Timeframe : Daily
An analysis of the price chart with the Central Patterns scanner (detector of chart patterns and resistances and supports) shows several results that can have an impact on the price change:
Near support of triangle
Type : Bullish
Timeframe : Daily
Horizontal support is broken
Type : Bearish
Timeframe : Daily
The presence of a bearish pattern in Japanese candlesticks detected by Central Candlesticks that could cause a correction in the very short term was also detected:
Black evening star
Type : Bearish
Timeframe : Daily
| S3 | S2 | S1 | Price | R1 | R2 | R3 | |
|---|---|---|---|---|---|---|---|
| ProTrendLines | 73.38 | 76.35 | 81.03 | 82.70 | 83.76 | 86.85 | 89.26 |
| Change (%) | -11.27% | -7.68% | -2.02% | - | +1.28% | +5.02% | +7.93% |
| Change | -9.32 | -6.35 | -1.67 | - | +1.06 | +4.15 | +6.56 |
| Level | Minor | Intermediate | Major | - | Major | Major | Minor |
To determine price objectives, it is also possible to use the pivot points. Here is the price position in relation to pivot points:
| Pivot points | S3 | S2 | S1 | PP | R1 | R2 | R3 |
|---|---|---|---|---|---|---|---|
| Standard | 81.04 | 82.16 | 83.01 | 84.13 | 84.98 | 86.10 | 86.95 |
| Camarilla | 83.31 | 83.49 | 83.67 | 83.85 | 84.03 | 84.21 | 84.39 |
| Woodie | 80.90 | 82.09 | 82.87 | 84.06 | 84.84 | 86.03 | 86.81 |
| Fibonacci | 82.16 | 82.92 | 83.38 | 84.13 | 84.89 | 85.35 | 86.10 |
| Pivot points | S3 | S2 | S1 | PP | R1 | R2 | R3 |
|---|---|---|---|---|---|---|---|
| Standard | 77.98 | 79.95 | 82.53 | 84.50 | 87.08 | 89.05 | 91.63 |
| Camarilla | 83.87 | 84.29 | 84.70 | 85.12 | 85.54 | 85.95 | 86.37 |
| Woodie | 78.30 | 80.10 | 82.85 | 84.65 | 87.40 | 89.20 | 91.95 |
| Fibonacci | 79.95 | 81.69 | 82.76 | 84.50 | 86.24 | 87.31 | 89.05 |
| Pivot points | S3 | S2 | S1 | PP | R1 | R2 | R3 |
|---|---|---|---|---|---|---|---|
| Standard | 63.12 | 71.76 | 77.02 | 85.66 | 90.92 | 99.56 | 104.82 |
| Camarilla | 78.45 | 79.72 | 81.00 | 82.27 | 83.54 | 84.82 | 86.09 |
| Woodie | 61.42 | 70.92 | 75.32 | 84.82 | 89.22 | 98.71 | 103.12 |
| Fibonacci | 71.76 | 77.07 | 80.35 | 85.66 | 90.97 | 94.25 | 99.56 |
Numerical data
The following are the details of the technical indicators and moving averages that were collected to generate this technical analysis:
| RSI (14): | 43.52 | |
| MACD (12,26,9): | -0.5100 | |
| Directional Movement: | -2.69 | |
| AROON (14): | -35.72 | |
| DEMA (21): | 83.86 | |
| Parabolic SAR (0,02-0,02-0,2): | 87.27 | |
| Elder Ray (13): | -0.40 | |
| Super Trend (3,10): | 89.30 | |
| Zig ZAG (10): | 82.70 | |
| VORTEX (21): | 0.9400 | |
| Stochastique (14,3,5): | 31.10 | |
| TEMA (21): | 83.58 | |
| Williams %R (14): | -87.94 | |
| Chande Momentum Oscillator (20): | -3.62 | |
| Repulse (5,40,3): | -4.0200 | |
| ROCnROLL: | 2 | |
| TRIX (15,9): | -0.0700 | |
| Courbe Coppock: | 0.50 |
| MA7: | 83.75 | |
| MA20: | 84.16 | |
| MA50: | 85.63 | |
| MA100: | 83.99 | |
| MAexp7: | 83.89 | |
| MAexp20: | 84.50 | |
| MAexp50: | 84.83 | |
| MAexp100: | 83.96 | |
| Price / MA7: | -1.25% | |
| Price / MA20: | -1.73% | |
| Price / MA50: | -3.42% | |
| Price / MA100: | -1.54% | |
| Price / MAexp7: | -1.42% | |
| Price / MAexp20: | -2.13% | |
| Price / MAexp50: | -2.51% | |
| Price / MAexp100: | -1.50% |
News
The latest news and videos published on AMERISOURCEBERGEN at the time of the analysis were as follows:
- Scott+Scott Attorneys at Law LLP Investigating Derivative Claims on Behalf of Shareholders of AmerisourceBergen Corporation - ABC
- Former AmerisourceBergen Executive Blows the Whistle on Massive Drug Overfill Laundering Scheme, Leading to $885 Million Combined Civil and Criminal Settlement
- AmerisourceBergen Corporation to Host Earnings Call
- AmerisourceBergen Corporation to Host Earnings Call
-
 AmerisourceBergen Unit To Plead Guilty In U.S. In $260 Million Settlement
About author

Online


Add a comment
Comments
0 comments on the analysis AMERISOURCEBERGEN - Daily