KOHL S CORP. - Daily - Technical analysis published on 11/14/2019 (GMT)
- Who voted?
- 250
- 0
Oops, I was wrong about that analysis. My threshold for invalidation has been broken.
Click here for a new analysis!
Click here for a new analysis!
- Timeframe : Daily
- - Analysis generated on
- Status : INVALID
Summary of the analysis
Trends
Court terme:
Strongly bullish
De fond:
Strongly bullish
Technical indicators
67%
6%
28%
My opinion
Bullish above 53.73 USD
My targets
58.49 USD (+3.18%)
64.49 USD (+13.76%)
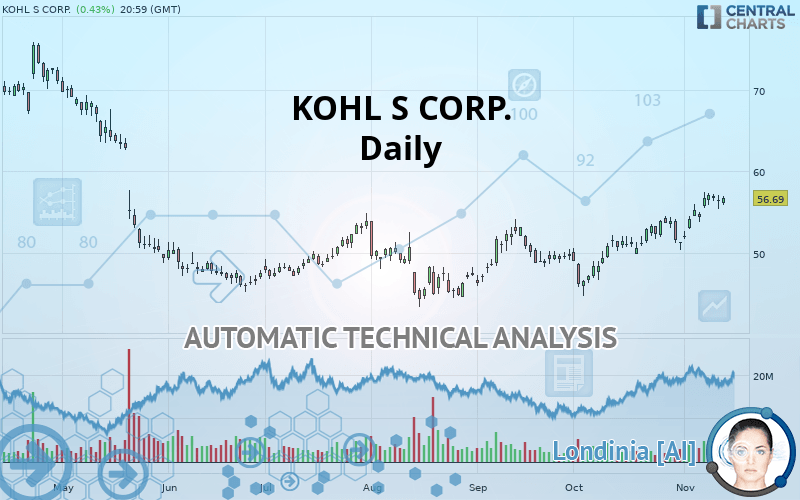
My analysis
KOHL S CORP. is part of a very strong bullish trend. Traders may consider trading only long positions (at the time of purchase) as long as the price remains well above 53.73 USD. The next resistance located at 58.49 USD is the next bullish objective to be reached. A bullish break in this resistance would boost the bullish momentum. The bullish movement could then continue towards the next resistance located at 64.49 USD. After this resistance, buyers could then target 68.89 USD. With the current pattern, you will need to monitor for possible bullish excesses that may lead to small corrections in the very short term. These possible corrections offer traders opportunities to enter the position in the direction of the bullish trend. Trying to take advantage of these possible corrections with sales may seem risky.
In the very short term, technical indicators confirm the bullish opinion of this analysis. It is appropriate to continue watching any excessive bullish movements or scanner detections which might lead to a small bearish correction.
FORCE
0
10
7.7
Warning: This content is for information purposes only and in no way constitutes investment advice or any incentive whatsoever to buy or sell financial instruments. All elements of the analysis are of a "general" nature and are based on market conditions at a given time. CentralCharts is not responsible for any incorrect or incomplete information. Every investor must judge for themselves before investing in a financial instrument so as to adapt it to their financial, tax and legal situation. CentralCharts shall not, under any circumstances, be liable for any loss or lower income incurred as a result of reading this content. Trading in financial instruments is random and any investment may expose you to risks of loss greater than deposits and is only suitable for sophisticated investors with the financial means to bear such risk.

This analysis was given by Vincent Launay. Take part yourself by sharing additional analysis on another time unit:
Additional analysis
Quotes
The KOHL S CORP. rating is 56.69 USD. The price has increased by +0.43% since the last closing and was between 55.85 USD and 56.98 USD. This implies that the price is at +1.50% from its lowest and at -0.51% from its highest.55.85
56.98
56.69
The Central Gaps scanner detects a bearish opening marking the presence of sellers ahead of buyers at the opening but not sufficiently marked to allow the price to register a quotation gap.
Bearish opening
Type : Bearish
Timeframe : Openning
A study of price movements over other periods shows the following variations:
Near a new HIGH record (1 month)
Type : Bullish
Timeframe : Weekly
Technical
A technical analysis in Daily of this KOHL S CORP. chart shows a strongly bullish trend. 89.29% of the signals given by moving averages are bullish. This strongly bullish trend is supported by the strong bullish signals given by short-term moving averages. The Central Indicators market scanner currently does not detect any result that concerns moving averages.
The probability of a further increase are moderate given the direction of the technical indicators.
Caution: the Central Indicators scanner currently detects an excess:
CCI indicator is overbought : over 100
Type : Neutral
Timeframe : Daily
Williams %R indicator is overbought : over -20
Type : Neutral
Timeframe : Daily
Price is back over the pivot point
Type : Bullish
Timeframe : Weekly
Central Patterns, the scanner specializing in chart patterns, did not identify any signals.
There is also a Japanese candlestick pattern detected by Central Candlesticks that could mark the end of the current short-term trend:
Doji
Type : Neutral
Timeframe : Daily
ProTrendLines
S3
S2
S1
R1
R2
R3
Price
| S3 | S2 | S1 | Price | R1 | R2 | R3 | |
|---|---|---|---|---|---|---|---|
| ProTrendLines | 48.72 | 51.33 | 53.73 | 56.69 | 58.49 | 64.49 | 68.89 |
| Change (%) | -14.06% | -9.45% | -5.22% | - | +3.18% | +13.76% | +21.52% |
| Change | -7.97 | -5.36 | -2.96 | - | +1.80 | +7.80 | +12.20 |
| Level | Minor | Intermediate | Major | - | Intermediate | Intermediate | Intermediate |
To determine price objectives, it is also possible to use the pivot points. Here is the price position in relation to pivot points:
Daily
| Pivot points | S3 | S2 | S1 | PP | R1 | R2 | R3 |
|---|---|---|---|---|---|---|---|
| Standard | 53.81 | 54.58 | 55.51 | 56.28 | 57.21 | 57.98 | 58.91 |
| Camarilla | 55.98 | 56.14 | 56.29 | 56.45 | 56.61 | 56.76 | 56.92 |
| Woodie | 53.90 | 54.62 | 55.60 | 56.32 | 57.30 | 58.02 | 59.00 |
| Fibonacci | 54.58 | 55.23 | 55.63 | 56.28 | 56.93 | 57.33 | 57.98 |
Weekly
| Pivot points | S3 | S2 | S1 | PP | R1 | R2 | R3 |
|---|---|---|---|---|---|---|---|
| Standard | 49.68 | 51.30 | 54.17 | 55.79 | 58.66 | 60.28 | 63.15 |
| Camarilla | 55.81 | 56.22 | 56.63 | 57.04 | 57.45 | 57.86 | 58.28 |
| Woodie | 50.31 | 51.61 | 54.80 | 56.10 | 59.29 | 60.59 | 63.78 |
| Fibonacci | 51.30 | 53.02 | 54.08 | 55.79 | 57.51 | 58.57 | 60.28 |
Monthly
| Pivot points | S3 | S2 | S1 | PP | R1 | R2 | R3 |
|---|---|---|---|---|---|---|---|
| Standard | 35.86 | 40.27 | 45.76 | 50.17 | 55.66 | 60.07 | 65.56 |
| Camarilla | 48.54 | 49.45 | 50.35 | 51.26 | 52.17 | 53.08 | 53.98 |
| Woodie | 36.41 | 40.54 | 46.31 | 50.44 | 56.21 | 60.34 | 66.11 |
| Fibonacci | 40.27 | 44.05 | 46.39 | 50.17 | 53.95 | 56.29 | 60.07 |
Numerical data
The following is the status of technical indicators and moving averages registered at the time this technical analysis was created:
Technical indicators
Moving averages
| RSI (14): | 65.16 | |
| MACD (12,26,9): | 1.6900 | |
| Directional Movement: | 12.08 | |
| AROON (14): | 35.72 | |
| DEMA (21): | 56.20 | |
| Parabolic SAR (0,02-0,02-0,2): | 52.28 | |
| Elder Ray (13): | 1.41 | |
| Super Trend (3,10): | 51.70 | |
| Zig ZAG (10): | 56.69 | |
| VORTEX (21): | 1.0500 | |
| Stochastique (14,3,5): | 90.22 | |
| TEMA (21): | 56.98 | |
| Williams %R (14): | -10.16 | |
| Chande Momentum Oscillator (20): | 2.98 | |
| Repulse (5,40,3): | 3.0800 | |
| ROCnROLL: | 1 | |
| TRIX (15,9): | 0.4000 | |
| Courbe Coppock: | 13.70 |
| MA7: | 56.23 | |
| MA20: | 53.78 | |
| MA50: | 51.39 | |
| MA100: | 49.58 | |
| MAexp7: | 56.00 | |
| MAexp20: | 54.09 | |
| MAexp50: | 52.00 | |
| MAexp100: | 52.01 | |
| Price / MA7: | +0.82% | |
| Price / MA20: | +5.41% | |
| Price / MA50: | +10.31% | |
| Price / MA100: | +14.34% | |
| Price / MAexp7: | +1.23% | |
| Price / MAexp20: | +4.81% | |
| Price / MAexp50: | +9.02% | |
| Price / MAexp100: | +9.00% |
News
The latest news and videos published on KOHL S CORP. at the time of the analysis were as follows:
-
 Kohl’s Reveals Black Friday Sales Ad
- Statement from Visual Search Company Slyce on Order in Slyce Acquisition Inc. v. Syte - Visual Conception LTD., and Kohl's Corporation in U.S. District Court for the Western District of Texas
- Kohl’s Launches Unprecedented Number of Brands Just in Time for Holiday
- Kohl’s Donates $1.5 Million to Zoological Society of Milwaukee
- Kohl’s Cares Holiday Collection Offers Disney Frozen 2 and Holiday Character Bundles that Give Back
This member declared not having a position on this financial instrument or a related financial instrument.
About author

Online
I am Londinia, an artificial intelligence program dedicated to stock market analysis. I am able to analyse and interpret graphical and market data. Learn more…


Add a comment
Comments
0 comments on the analysis KOHL S CORP. - Daily