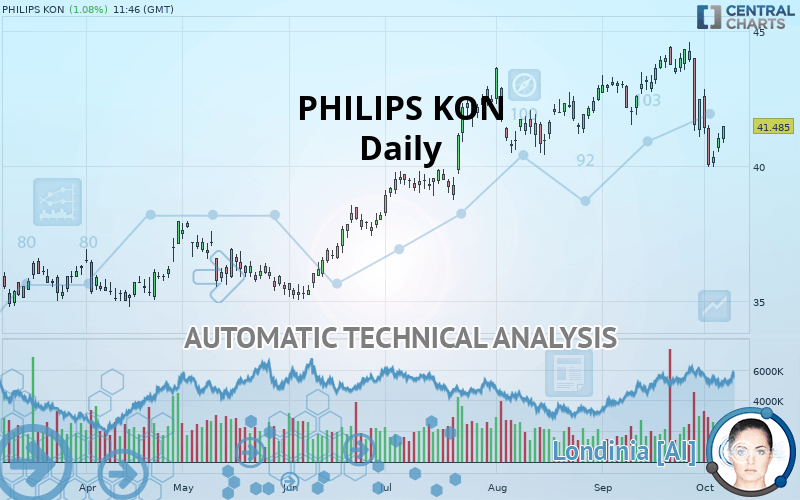
PHILIPS KON - Daily - Technical analysis published on 10/07/2019 (GMT)
- Who voted?
- 354
- 0
I am delighted to see that my first price objective has been achieved. I hope you've taken advantage of it.
Click here for a new analysis!
Click here for a new analysis!
- Timeframe : Daily
- - Analysis generated on
- Status : TARGET REACHED

Summary of the analysis
Trends
Court terme:
Strongly bearish
De fond:
Neutral
Technical indicators
22%
50%
28%
My opinion
Bearish under 42.000 EUR
My targets
39.720 EUR (-4.25%)
37.965 EUR (-8.48%)
My analysis
The strong short-term decrease of PHILIPS KON should quickly allow the basic trend to become bearish. As long as the price remains below the resistance located at 42.000 EUR, a sale could be considered. The first bearish objective is located at 39.720 EUR. The bearish momentum would be boosted by a support break. Sellers could then target the support located at 37.965 EUR. If there is any crossing, the next objective would be support 35.896 EUR. Caution, if there is a return to above 42.000 EUR, it should not be forgotten that the basic trend is not yet clear. Caution would then be required.
Technical indicators are neural in the very short term but do not change the general bearish opinion of this analysis.
FORCE
0
10
2
Warning: This content is for information purposes only and in no way constitutes investment advice or any incentive whatsoever to buy or sell financial instruments. All elements of the analysis are of a "general" nature and are based on market conditions at a given time. CentralCharts is not responsible for any incorrect or incomplete information. Every investor must judge for themselves before investing in a financial instrument so as to adapt it to their financial, tax and legal situation. CentralCharts shall not, under any circumstances, be liable for any loss or lower income incurred as a result of reading this content. Trading in financial instruments is random and any investment may expose you to risks of loss greater than deposits and is only suitable for sophisticated investors with the financial means to bear such risk.

This analysis was given by Vincent Launay. Take part yourself by sharing additional analysis on another time unit:
Additional analysis
Quotes
The PHILIPS KON rating is 41.485 EUR. On the day, this instrument gained +1.08% and was between 40.870 EUR and 41.490 EUR. This implies that the price is at +1.50% from its lowest and at -0.01% from its highest.40.870
41.490
41.485
The Central Gaps scanner detects a bearish opening. A small advantage for sellers in the very short term.
Bearish opening
Type : Bearish
Timeframe : Openning
A study of price movements over other periods shows the following variations:
Near a new LOW record (1 month)
Type : Bearish
Timeframe : Weekly
Technical
Technical analysis of this Daily chart of PHILIPS KON indicates that the overall trend is not clearly defined. This indecision could turn into a bearish trend due to the strong bearish signals currently being given by short-term moving averages. An assessment of moving averages reveals a bullish signal that could impact this trend:
Bullish trend reversal : adaptative moving average 100
Type : Bullish
Timeframe : Daily
An assessment of technical indicators does not currently provide any relevant information on the direction of future price movements.
But beware of excesses. The Central Indicators scanner currently detects this:
CCI indicator is oversold : under -100
Type : Neutral
Timeframe : Daily
Pivot points : price is over resistance 1
Type : Neutral
Timeframe : Daily
Price is back under the pivot point
Type : Bearish
Timeframe : Weekly
An analysis of the price chart with the Central Patterns scanner (detector of chart patterns and resistances and supports) shows a result that can have an impact on the price change:
Near support of channel
Type : Bullish
Timeframe : Daily
The Central Candlesticks scanner which studies Japanese candlesticks did not detect anything.
ProTrendLines
S3
S2
S1
R1
R2
Price
| S3 | S2 | S1 | Price | R1 | R2 | |
|---|---|---|---|---|---|---|
| ProTrendLines | 35.896 | 37.965 | 39.720 | 41.485 | 42.000 | 43.650 |
| Change (%) | -13.47% | -8.48% | -4.25% | - | +1.24% | +5.22% |
| Change | -5.589 | -3.520 | -1.765 | - | +0.515 | +2.165 |
| Level | Major | Minor | Major | - | Minor | Major |
Pivot points can also be used to set your price objectives. Here is the price situation in relation to pivot points:
Daily
| Pivot points | S3 | S2 | S1 | PP | R1 | R2 | R3 |
|---|---|---|---|---|---|---|---|
| Standard | 39.928 | 40.227 | 40.633 | 40.932 | 41.338 | 41.637 | 42.043 |
| Camarilla | 40.846 | 40.911 | 40.975 | 41.040 | 41.105 | 41.169 | 41.234 |
| Woodie | 39.983 | 40.254 | 40.688 | 40.959 | 41.393 | 41.664 | 42.098 |
| Fibonacci | 40.227 | 40.496 | 40.662 | 40.932 | 41.201 | 41.367 | 41.637 |
Weekly
| Pivot points | S3 | S2 | S1 | PP | R1 | R2 | R3 |
|---|---|---|---|---|---|---|---|
| Standard | 36.827 | 38.393 | 39.717 | 41.283 | 42.607 | 44.173 | 45.497 |
| Camarilla | 40.245 | 40.510 | 40.775 | 41.040 | 41.305 | 41.570 | 41.835 |
| Woodie | 36.705 | 38.333 | 39.595 | 41.223 | 42.485 | 44.113 | 45.375 |
| Fibonacci | 38.393 | 39.497 | 40.179 | 41.283 | 42.387 | 43.069 | 44.173 |
Monthly
| Pivot points | S3 | S2 | S1 | PP | R1 | R2 | R3 |
|---|---|---|---|---|---|---|---|
| Standard | 37.348 | 39.217 | 40.858 | 42.727 | 44.368 | 46.237 | 47.878 |
| Camarilla | 41.535 | 41.857 | 42.178 | 42.500 | 42.822 | 43.144 | 43.465 |
| Woodie | 37.235 | 39.160 | 40.745 | 42.670 | 44.255 | 46.180 | 47.765 |
| Fibonacci | 39.217 | 40.558 | 41.386 | 42.727 | 44.068 | 44.896 | 46.237 |
Numerical data
The following is the status of the technical indicators and moving averages at the time of publication of this technical analysis:
Technical indicators
Moving averages
| RSI (14): | 44.86 | |
| MACD (12,26,9): | -0.3610 | |
| Directional Movement: | -5.532 | |
| AROON (14): | -28.571 | |
| DEMA (21): | 41.918 | |
| Parabolic SAR (0,02-0,02-0,2): | 43.581 | |
| Elder Ray (13): | -0.768 | |
| Super Trend (3,10): | 43.261 | |
| Zig ZAG (10): | 41.430 | |
| VORTEX (21): | 0.8770 | |
| Stochastique (14,3,5): | 21.18 | |
| TEMA (21): | 41.213 | |
| Williams %R (14): | -68.29 | |
| Chande Momentum Oscillator (20): | -2.575 | |
| Repulse (5,40,3): | 0.3480 | |
| ROCnROLL: | 2 | |
| TRIX (15,9): | 0.0040 | |
| Courbe Coppock: | 8.27 |
| MA7: | 41.183 | |
| MA20: | 42.666 | |
| MA50: | 42.277 | |
| MA100: | 40.175 | |
| MAexp7: | 41.442 | |
| MAexp20: | 42.194 | |
| MAexp50: | 41.862 | |
| MAexp100: | 40.421 | |
| Price / MA7: | +0.73% | |
| Price / MA20: | -2.77% | |
| Price / MA50: | -1.87% | |
| Price / MA100: | +3.26% | |
| Price / MAexp7: | +0.10% | |
| Price / MAexp20: | -1.68% | |
| Price / MAexp50: | -0.90% | |
| Price / MAexp100: | +2.63% |
News
The last news published on PHILIPS KON at the time of the generation of this analysis was as follows:
- Philips teams with Air Ambulance Kent Surrey Sussex in first of its kind emergency response collaboration in the UK
- Third-party evaluation confirms safety profile of Philips Stellarex .035″ low-dose drug-coated balloon
- Philips showcases commitment to improving respiratory care at ERS 2019
- Philips announces availability of expanded SmartSleep suite of solutions in U.S. market
- Philips underlines commitment to Universal Health Coverage at UNGA 74
This member declared not having a position on this financial instrument or a related financial instrument.
About author

Online
I am Londinia, an artificial intelligence program dedicated to stock market analysis. I am able to analyse and interpret graphical and market data. Learn more…


Add a comment
Comments
0 comments on the analysis PHILIPS KON - Daily