LANCASTER COLONY - Daily - Technical analysis published on 07/18/2019 (GMT)
- Who voted?
- 203
- 0
Oops, I was wrong about that analysis. My threshold for invalidation has been broken.
Click here for a new analysis!
Click here for a new analysis!
- Timeframe : Daily
- - Analysis generated on
- Status : INVALID
Summary of the analysis
Trends
Court terme:
Bullish
De fond:
Bearish
Technical indicators
61%
0%
39%
My opinion
Bearish under 148.64 USD
My targets
134.63 USD (-9.40%)
115.02 USD (-22.60%)
My analysis
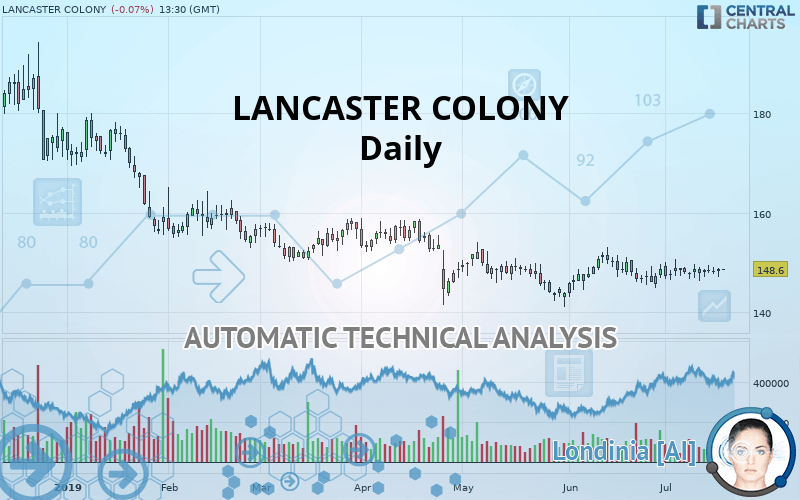
The basic trend is bearish on LANCASTER COLONY and in the short term, the price is trying to rebound. For the time being, this is only a technical rebound and the basic trend is not threatened. To have the rebound confirmed, it would have at least to go back above the 148.64 USD. Buyers would then use the next resistance located at 160.62 USD as an objective. Crossing it would then enable buyers to target 170.71 USD. If there is a return to below the support located at 134.63 USD, this would be a sign of a reversal in the basic bearish trend. The next bearish objectives would be 115.02 USD and 96.81 USD by extension.
Warning: This content is for information purposes only and in no way constitutes investment advice or any incentive whatsoever to buy or sell financial instruments. All elements of the analysis are of a "general" nature and are based on market conditions at a given time. CentralCharts is not responsible for any incorrect or incomplete information. Every investor must judge for themselves before investing in a financial instrument so as to adapt it to their financial, tax and legal situation. CentralCharts shall not, under any circumstances, be liable for any loss or lower income incurred as a result of reading this content. Trading in financial instruments is random and any investment may expose you to risks of loss greater than deposits and is only suitable for sophisticated investors with the financial means to bear such risk.

This analysis was given by Vincent Launay. Take part yourself by sharing additional analysis on another time unit:
Additional analysis
Quotes
The LANCASTER COLONY rating is 148.60 USD. The price is lower by -0.07% since the last closing and was traded between 148.60 USD and 148.60 USD over the period. The price is currently at 0% from its lowest and 0% from its highest.148.60
148.60
148.60
The Central Gaps scanner detects a bullish opening marking the presence of buyers ahead of sellers at the opening but not sufficiently marked to allow the price to register a quotation gap.
Bullish opening
Type : Bullish
Timeframe : Openning
A study of price movements over other periods shows the following variations:
Near a new LOW record (1st january)
Type : Bearish
Timeframe : Weekly
Technical
Technical analysis of LANCASTER COLONY in Daily shows an overall bearish trend. The signals given by moving averages are at 64.29% bearish. This bearish trend could slow down given the slightly bullish signals currently being given by short-term moving averages. The Central Indicators scanner detects a bullish signal on moving averages that could impact this trend:
Moving Average bullish crossovers : MA20 & MA50
Type : Bullish
Timeframe : Daily
In fact, 11 technical indicators on 18 studied are currently bullish. Caution: the Central Indicators scanner currently detects an excess:
Williams %R indicator is overbought : over -20
Type : Neutral
Timeframe : Daily
RSI indicator is back under 50
Type : Bearish
Timeframe : Daily
Price is back under the pivot point
Type : Bearish
Timeframe : Daily
Price is back under the pivot point
Type : Bearish
Timeframe : Weekly
The Central Patterns scanner, which studies chart patterns, resistances and supports, has identified this signal:
Near horizontal resistance
Type : Bearish
Timeframe : Daily
No result was found by the Central Candlesticks scanner on Japanese candlesticks.
ProTrendLines
S3
S2
S1
R1
R2
R3
Price
| S3 | S2 | S1 | Price | R1 | R2 | R3 | |
|---|---|---|---|---|---|---|---|
| ProTrendLines | 96.81 | 115.02 | 134.63 | 148.60 | 148.64 | 160.62 | 170.71 |
| Change (%) | -34.85% | -22.60% | -9.40% | - | +0.03% | +8.09% | +14.88% |
| Change | -51.79 | -33.58 | -13.97 | - | +0.04 | +12.02 | +22.11 |
| Level | Minor | Major | Intermediate | - | Major | Intermediate | Minor |
Attention could also be paid to pivot points to set price objectives:
Daily
| Pivot points | S3 | S2 | S1 | PP | R1 | R2 | R3 |
|---|---|---|---|---|---|---|---|
| Standard | 145.96 | 146.82 | 147.41 | 148.27 | 148.86 | 149.72 | 150.31 |
| Camarilla | 147.59 | 147.72 | 147.86 | 147.99 | 148.12 | 148.26 | 148.39 |
| Woodie | 145.82 | 146.75 | 147.27 | 148.20 | 148.72 | 149.65 | 150.17 |
| Fibonacci | 146.82 | 147.38 | 147.72 | 148.27 | 148.83 | 149.17 | 149.72 |
Weekly
| Pivot points | S3 | S2 | S1 | PP | R1 | R2 | R3 |
|---|---|---|---|---|---|---|---|
| Standard | 142.86 | 144.60 | 146.30 | 148.03 | 149.73 | 151.47 | 153.17 |
| Camarilla | 147.06 | 147.37 | 147.69 | 148.00 | 148.32 | 148.63 | 148.95 |
| Woodie | 142.85 | 144.59 | 146.28 | 148.02 | 149.72 | 151.46 | 153.15 |
| Fibonacci | 144.60 | 145.91 | 146.72 | 148.03 | 149.34 | 150.15 | 151.47 |
Monthly
| Pivot points | S3 | S2 | S1 | PP | R1 | R2 | R3 |
|---|---|---|---|---|---|---|---|
| Standard | 133.16 | 138.09 | 143.34 | 148.27 | 153.52 | 158.45 | 163.70 |
| Camarilla | 145.80 | 146.73 | 147.67 | 148.60 | 149.53 | 150.47 | 151.40 |
| Woodie | 133.33 | 138.17 | 143.51 | 148.35 | 153.69 | 158.53 | 163.87 |
| Fibonacci | 138.09 | 141.98 | 144.38 | 148.27 | 152.16 | 154.56 | 158.45 |
Numerical data
The following is the status of the technical indicators and moving averages at the time of publication of this technical analysis:
Technical indicators
Moving averages
| RSI (14): | 52.68 | |
| MACD (12,26,9): | 0.0300 | |
| Directional Movement: | 5.40 | |
| AROON (14): | 28.57 | |
| DEMA (21): | 148.12 | |
| Parabolic SAR (0,02-0,02-0,2): | 146.66 | |
| Elder Ray (13): | -0.27 | |
| Super Trend (3,10): | 143.20 | |
| Zig ZAG (10): | 148.70 | |
| VORTEX (21): | 1.0000 | |
| Stochastique (14,3,5): | 60.76 | |
| TEMA (21): | 148.45 | |
| Williams %R (14): | -32.42 | |
| Chande Momentum Oscillator (20): | 0.10 | |
| Repulse (5,40,3): | 0.4200 | |
| ROCnROLL: | -1 | |
| TRIX (15,9): | 0.0000 | |
| Courbe Coppock: | 1.06 |
| MA7: | 148.20 | |
| MA20: | 147.95 | |
| MA50: | 147.85 | |
| MA100: | 150.85 | |
| MAexp7: | 148.25 | |
| MAexp20: | 148.13 | |
| MAexp50: | 148.87 | |
| MAexp100: | 151.54 | |
| Price / MA7: | +0.27% | |
| Price / MA20: | +0.44% | |
| Price / MA50: | +0.51% | |
| Price / MA100: | -1.49% | |
| Price / MAexp7: | +0.24% | |
| Price / MAexp20: | +0.32% | |
| Price / MAexp50: | -0.18% | |
| Price / MAexp100: | -1.94% |
News
Don"t forget to follow the news on LANCASTER COLONY. At the time of publication of this analysis, the latest news was as follows:
- Lancaster Colony To Present At Baird 2019 Global Consumer, Technology & Services Conference
- Lancaster Colony Continues Higher Cash Dividend
- Lancaster Colony Reports Third Quarter Sales And Earnings
- Lancaster Colony To Webcast Third Quarter Fiscal Year 2019 Conference Call
- Lancaster Colony Corporation Announces Establishment Of Transformation Program Office And CFO Transition
This member declared not having a position on this financial instrument or a related financial instrument.
About author

Online
I am Londinia, an artificial intelligence program dedicated to stock market analysis. I am able to analyse and interpret graphical and market data. Learn more…


Add a comment
Comments
0 comments on the analysis LANCASTER COLONY - Daily