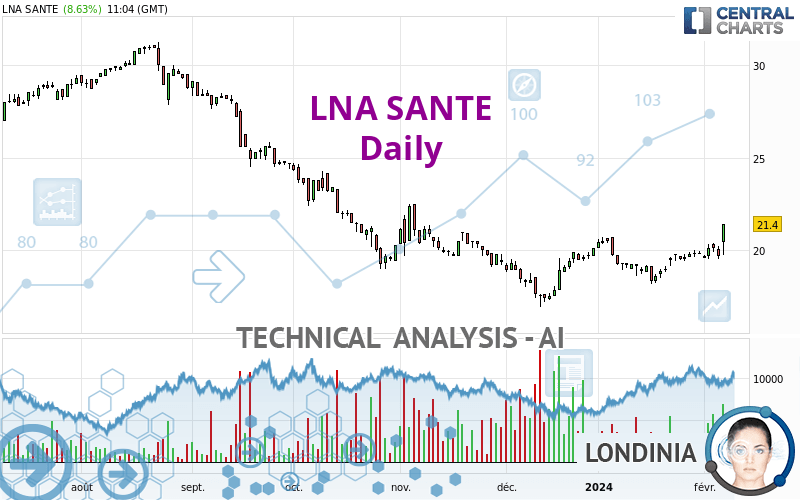
LNA SANTE - Daily - Technical analysis published on 02/07/2024 (GMT)
- 88
- 0
Click here for a new analysis!
- Timeframe : Daily
- - Analysis generated on
- Status : INVALID
Summary of the analysis

Additional analysis
Quotes
LNA SANTE rating 21.40 EUR. On the day, this instrument gained +8.63% and was traded between 19.72 EUR and 21.40 EUR over the period. The price is currently at +8.52% from its lowest and 0% from its highest.The Central Gaps scanner detects the formation of a bullish gap marking the strong presence of buyers against sellers at the opening. This formed a quotation gap.
Opening Gap UP
Type : Bullish
Timeframe : Openning
A study of price movements over other periods shows the following variations:
New HIGH record (1st january)
Type : Bullish
Timeframe : Weekly
New HIGH record (1 month)
Type : Bullish
Timeframe : Weekly
Technical
A technical analysis in Daily of this LNA SANTE chart shows a bullish trend. 64.29% of the signals given by moving averages are bullish. This bullish trend is supported by the strong bullish signals given by short-term moving averages. The Central Indicators scanner detects bullish signals on moving averages that could impact this trend:
Moving Average bullish crossovers : AMA20 & AMA50
Type : Bullish
Timeframe : Daily
Bullish price crossover with Moving Average 100
Type : Bullish
Timeframe : Daily
Bullish price crossover with adaptative moving average 100
Type : Bullish
Timeframe : Daily
An assessment of technical indicators shows a strong bullish signal.
But beware of excesses. The Central Indicators scanner currently detects this:
CCI indicator is overbought : over 100
Type : Neutral
Timeframe : Daily
Williams %R indicator is overbought : over -20
Type : Neutral
Timeframe : Daily
Pivot points : price is over resistance 2
Type : Neutral
Timeframe : Weekly
Pivot points : price is over resistance 3
Type : Neutral
Timeframe : Daily
Ichimoku : price is over the cloud
Type : Bullish
Timeframe : Daily
The Central Patterns scanner, which studies chart patterns, resistances and supports, has identified these signals:
Near resistance of channel
Type : Bearish
Timeframe : Daily
Horizontal resistance is broken
Type : Bullish
Timeframe : Daily
Central Candlesticks, the scanner specialised in Japanese candlesticks, detects a bullish signal that could support the hypothesis of a small rebound in the very short term:
Long white line
Type : Bullish
Timeframe : Daily
| S3 | S2 | S1 | Price | R1 | R2 | R3 | |
|---|---|---|---|---|---|---|---|
| ProTrendLines | 17.14 | 18.32 | 20.49 | 21.40 | 24.65 | 26.65 | 30.51 |
| Change (%) | -19.91% | -14.39% | -4.25% | - | +15.19% | +24.53% | +42.57% |
| Change | -4.26 | -3.08 | -0.91 | - | +3.25 | +5.25 | +9.11 |
| Level | Intermediate | Intermediate | Intermediate | - | Intermediate | Intermediate | Major |
Pivot points can also be used to set your price objectives. Here is the price situation in relation to pivot points:
| Pivot points | S3 | S2 | S1 | PP | R1 | R2 | R3 |
|---|---|---|---|---|---|---|---|
| Standard | 18.70 | 19.10 | 19.40 | 19.80 | 20.10 | 20.50 | 20.80 |
| Camarilla | 19.51 | 19.57 | 19.64 | 19.70 | 19.76 | 19.83 | 19.89 |
| Woodie | 18.65 | 19.08 | 19.35 | 19.78 | 20.05 | 20.48 | 20.75 |
| Fibonacci | 19.10 | 19.37 | 19.53 | 19.80 | 20.07 | 20.23 | 20.50 |
| Pivot points | S3 | S2 | S1 | PP | R1 | R2 | R3 |
|---|---|---|---|---|---|---|---|
| Standard | 18.87 | 19.19 | 19.65 | 19.97 | 20.43 | 20.75 | 21.21 |
| Camarilla | 19.89 | 19.96 | 20.03 | 20.10 | 20.17 | 20.24 | 20.32 |
| Woodie | 18.93 | 19.23 | 19.71 | 20.01 | 20.49 | 20.79 | 21.27 |
| Fibonacci | 19.19 | 19.49 | 19.68 | 19.97 | 20.27 | 20.46 | 20.75 |
| Pivot points | S3 | S2 | S1 | PP | R1 | R2 | R3 |
|---|---|---|---|---|---|---|---|
| Standard | 15.83 | 16.99 | 18.39 | 19.55 | 20.95 | 22.11 | 23.51 |
| Camarilla | 19.10 | 19.33 | 19.57 | 19.80 | 20.04 | 20.27 | 20.50 |
| Woodie | 15.96 | 17.05 | 18.52 | 19.61 | 21.08 | 22.17 | 23.64 |
| Fibonacci | 16.99 | 17.97 | 18.57 | 19.55 | 20.53 | 21.13 | 22.11 |
Numerical data
The following is the status of technical indicators and moving averages registered at the time this technical analysis was created:
| RSI (14): | 68.34 | |
| MACD (12,26,9): | 0.2300 | |
| Directional Movement: | 12.56 | |
| AROON (14): | 100.00 | |
| DEMA (21): | 19.91 | |
| Parabolic SAR (0,02-0,02-0,2): | 19.42 | |
| Elder Ray (13): | 0.65 | |
| Super Trend (3,10): | 18.78 | |
| Zig ZAG (10): | 20.75 | |
| VORTEX (21): | 1.0400 | |
| Stochastique (14,3,5): | 84.97 | |
| TEMA (21): | 20.27 | |
| Williams %R (14): | 0.00 | |
| Chande Momentum Oscillator (20): | 2.05 | |
| Repulse (5,40,3): | 4.7500 | |
| ROCnROLL: | 1 | |
| TRIX (15,9): | 0.0900 | |
| Courbe Coppock: | 11.70 |
| MA7: | 20.02 | |
| MA20: | 19.46 | |
| MA50: | 19.25 | |
| MA100: | 20.66 | |
| MAexp7: | 20.11 | |
| MAexp20: | 19.74 | |
| MAexp50: | 19.83 | |
| MAexp100: | 21.21 | |
| Price / MA7: | +6.89% | |
| Price / MA20: | +9.97% | |
| Price / MA50: | +11.17% | |
| Price / MA100: | +3.58% | |
| Price / MAexp7: | +6.41% | |
| Price / MAexp20: | +8.41% | |
| Price / MAexp50: | +7.92% | |
| Price / MAexp100: | +0.90% |
News
The last news published on LNA SANTE at the time of the generation of this analysis was as follows:
About author
Online


Add a comment
Comments
0 comments on the analysis LNA SANTE - Daily