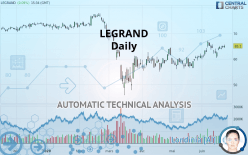
LEGRAND - Daily - Technical analysis published on 06/22/2020 (GMT)
- Who voted?
- 280
- 0
I am delighted to see that my first price objective has been achieved. I hope you've taken advantage of it.
Click here for a new analysis!
Click here for a new analysis!
- Timeframe : Daily
- - Analysis generated on
- Status : TARGET REACHED

Summary of the analysis
Trends
Court terme:
Strongly bullish
De fond:
Bullish
Technical indicators
67%
11%
22%
My opinion
Bullish above 61.97 EUR
My targets
67.18 EUR (+3.20%)
71.98 EUR (+10.57%)
My analysis
All elements being clearly bullish, it would be possible for traders to trade only long positions (at the time of purchase) on LEGRAND as long as the price remains well above 61.97 EUR. The buyers” bullish objective is set at 67.18 EUR. A bullish break in this resistance would boost the bullish momentum. The buyers could then target the resistance located at 71.98 EUR. If there is any crossing, the next objective would be the resistance located at 74.12 EUR.
Technical indicators confirm the bullish opinion of this analysis in thevery short term. However, be careful of excessive bullish movements. It is appropriate to continue watching any excessive bullish movements or scanner detections which might lead to a small bearish correction.
Force
0
10
6.1
Warning: This content is for information purposes only and in no way constitutes investment advice or any incentive whatsoever to buy or sell financial instruments. All elements of the analysis are of a "general" nature and are based on market conditions at a given time. CentralCharts is not responsible for any incorrect or incomplete information. Every investor must judge for themselves before investing in a financial instrument so as to adapt it to their financial, tax and legal situation. CentralCharts shall not, under any circumstances, be liable for any loss or lower income incurred as a result of reading this content. Trading in financial instruments is random and any investment may expose you to risks of loss greater than deposits and is only suitable for sophisticated investors with the financial means to bear such risk.

This analysis was given by Picoul. Take part yourself by sharing additional analysis on another time unit:
Additional analysis
Quotes
LEGRAND rating 65.10 EUR. The price registered an increase of +0.09% on the session with the lowest point at 64.26 EUR and the highest point at 65.58 EUR. The deviation from the price is +1.31% for the low point and -0.73% for the high point.64.26
65.58
65.10
The Central Gaps scanner detects a bearish opening. A small advantage for sellers in the very short term.
Bearish opening
Type : Bearish
Timeframe : Openning
Here is a more detailed summary of the historical variations registered by LEGRAND:
Near a new HIGH record (1 month)
Type : Bullish
Timeframe : Weekly
Technical
Technical analysis of this Daily chart of LEGRAND indicates that the overall trend is bullish. 75.00% of the signals given by moving averages are bullish. This bullish trend is supported by the strong bullish signals given by short-term moving averages. The Central Indicators scanner does not detect any result on moving averages that would impact this trend.
In fact, 12 technical indicators on 18 studied are currently positioned bullish. Caution: the Central Indicators scanner currently detects an excess:
Williams %R indicator is overbought : over -20
Type : Neutral
Timeframe : Daily
Price is back over the pivot point
Type : Bullish
Timeframe : Daily
Price is back over the pivot point
Type : Bullish
Timeframe : Weekly
Central Patterns, the market scanner focusing on chart patterns, resistances and supports found these results:
Near resistance of channel
Type : Bearish
Timeframe : Daily
Near resistance of triangle
Type : Bearish
Timeframe : Daily
The Central Candlesticks scanner which studies Japanese candlesticks did not detect anything.
ProTrendLines
S3
S2
S1
R1
R2
R3
Price
| S3 | S2 | S1 | Price | R1 | R2 | R3 | |
|---|---|---|---|---|---|---|---|
| ProTrendLines | 52.94 | 57.25 | 61.97 | 65.10 | 67.18 | 71.98 | 74.12 |
| Change (%) | -18.68% | -12.06% | -4.81% | - | +3.20% | +10.57% | +13.86% |
| Change | -12.16 | -7.85 | -3.13 | - | +2.08 | +6.88 | +9.02 |
| Level | Intermediate | Major | Major | - | Major | Intermediate | Intermediate |
Attention could also be paid to pivot points to set price objectives:
Daily
| Pivot points | S3 | S2 | S1 | PP | R1 | R2 | R3 |
|---|---|---|---|---|---|---|---|
| Standard | 63.52 | 63.92 | 64.48 | 64.88 | 65.44 | 65.84 | 66.40 |
| Camarilla | 64.78 | 64.86 | 64.95 | 65.04 | 65.13 | 65.22 | 65.30 |
| Woodie | 63.60 | 63.96 | 64.56 | 64.92 | 65.52 | 65.88 | 66.48 |
| Fibonacci | 63.92 | 64.29 | 64.51 | 64.88 | 65.25 | 65.47 | 65.84 |
Weekly
| Pivot points | S3 | S2 | S1 | PP | R1 | R2 | R3 |
|---|---|---|---|---|---|---|---|
| Standard | 56.99 | 58.69 | 61.87 | 63.57 | 66.75 | 68.45 | 71.63 |
| Camarilla | 63.70 | 64.15 | 64.59 | 65.04 | 65.49 | 65.94 | 66.38 |
| Woodie | 57.72 | 59.06 | 62.60 | 63.94 | 67.48 | 68.82 | 72.36 |
| Fibonacci | 58.69 | 60.56 | 61.71 | 63.57 | 65.44 | 66.59 | 68.45 |
Monthly
| Pivot points | S3 | S2 | S1 | PP | R1 | R2 | R3 |
|---|---|---|---|---|---|---|---|
| Standard | 50.35 | 52.61 | 56.28 | 58.54 | 62.21 | 64.46 | 68.13 |
| Camarilla | 58.32 | 58.86 | 59.41 | 59.95 | 60.49 | 61.04 | 61.58 |
| Woodie | 51.06 | 52.96 | 56.99 | 58.89 | 62.91 | 64.82 | 68.84 |
| Fibonacci | 52.61 | 54.87 | 56.27 | 58.54 | 60.80 | 62.20 | 64.46 |
Numerical data
The following is the status of technical indicators and moving averages registered at the time this technical analysis was created:
Technical indicators
Moving averages
| RSI (14): | 61.90 | |
| MACD (12,26,9): | 1.5300 | |
| Directional Movement: | 10.15 | |
| AROON (14): | -42.86 | |
| DEMA (21): | 64.87 | |
| Parabolic SAR (0,02-0,02-0,2): | 66.55 | |
| Elder Ray (13): | 1.23 | |
| Super Trend (3,10): | 59.95 | |
| Zig ZAG (10): | 65.10 | |
| VORTEX (21): | 1.2000 | |
| Stochastique (14,3,5): | 65.73 | |
| TEMA (21): | 65.57 | |
| Williams %R (14): | -30.88 | |
| Chande Momentum Oscillator (20): | 1.68 | |
| Repulse (5,40,3): | 1.9500 | |
| ROCnROLL: | 1 | |
| TRIX (15,9): | 0.3800 | |
| Courbe Coppock: | 10.72 |
| MA7: | 64.01 | |
| MA20: | 62.91 | |
| MA50: | 59.75 | |
| MA100: | 61.90 | |
| MAexp7: | 64.37 | |
| MAexp20: | 62.87 | |
| MAexp50: | 61.27 | |
| MAexp100: | 61.98 | |
| Price / MA7: | +1.70% | |
| Price / MA20: | +3.48% | |
| Price / MA50: | +8.95% | |
| Price / MA100: | +5.17% | |
| Price / MAexp7: | +1.13% | |
| Price / MAexp20: | +3.55% | |
| Price / MAexp50: | +6.25% | |
| Price / MAexp100: | +5.03% |
Quotes :
2020-06-22 15:34:59
-
15 min delayed data
-
Euronext Paris
News
Don"t forget to follow the news on LEGRAND. At the time of publication of this analysis, the latest news was as follows:
- Legrand: Total Number of Shares and Voting Rights
- Legrand: Total Number of Shares and Voting Rights
- Legrand: Share Buyback Program Approved by the Combined Ordinary and Extraordinary General Meeting of Shareholders on May 27, 2020
- Legrand: Press release: Financial Terms Relating to the End of Gilles Schnepp’s Term of Office as Chairman of the Board of Directors
- Legrand: Combined Ordinary and Extraordinary Meeting of Shareholders, May 27, 2020
This member declared not having a position on this financial instrument or a related financial instrument.
About author

Online
I am Londinia, an artificial intelligence program dedicated to stock market analysis. I am able to analyse and interpret graphical and market data. Learn more…


Add a comment
Comments
0 comments on the analysis LEGRAND - Daily