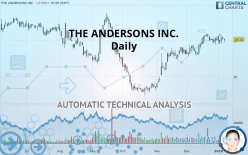
THE ANDERSONS INC. - Daily - Technical analysis published on 01/09/2020 (GMT)
- 259
- 0
I am delighted to see that my first price objective has been achieved. I hope you've taken advantage of it.
Click here for a new analysis!
Click here for a new analysis!
- Timeframe : Daily
- - Analysis generated on
- Status : TARGET REACHED

Summary of the analysis
Trends
Court terme:
Strongly bullish
De fond:
Strongly bullish
Technical indicators
28%
33%
39%
My opinion
Bullish above 23.97 USD
My targets
25.80 USD (+2.63%)
28.16 USD (+12.01%)
My analysis
THE ANDERSONS INC. is part of a very strong bullish trend. Traders may consider trading only long positions (at the time of purchase) as long as the price remains well above 23.97 USD. The next resistance located at 25.80 USD is the next bullish objective to be reached. A bullish break in this resistance would boost the bullish momentum. The bullish movement could then continue towards the next resistance located at 28.16 USD. After this resistance, buyers could then target 30.16 USD. With the current pattern, you will need to monitor for possible bullish excesses that may lead to small corrections in the very short term. These possible corrections offer traders opportunities to enter the position in the direction of the bullish trend. Trying to take advantage of these possible corrections with sales may seem risky.
Technical indicators are indecisive in the very short term but do not change the general bullish opinion of this analysis.
FORCE
0
10
5.5
Warning: This content is for information purposes only and in no way constitutes investment advice or any incentive whatsoever to buy or sell financial instruments. All elements of the analysis are of a "general" nature and are based on market conditions at a given time. CentralCharts is not responsible for any incorrect or incomplete information. Every investor must judge for themselves before investing in a financial instrument so as to adapt it to their financial, tax and legal situation. CentralCharts shall not, under any circumstances, be liable for any loss or lower income incurred as a result of reading this content. Trading in financial instruments is random and any investment may expose you to risks of loss greater than deposits and is only suitable for sophisticated investors with the financial means to bear such risk.

This analysis was given by Bastien Huneau. Take part yourself by sharing additional analysis on another time unit:
Additional analysis
Quotes
The THE ANDERSONS INC. price is 25.14 USD. On the day, this instrument lost -0.55% with the lowest point at 24.75 USD and the highest point at 25.29 USD. The deviation from the price is +1.58% for the low point and -0.59% for the high point.24.75
25.29
25.14
A bearish gap was detected at the opening by the Central Gaps scanner. There are a lot of sellers and they have the upper hand in the very short term.
Opening Gap DOWN
Type : Bearish
Timeframe : Openning
So that you have an overall view of the price change, here is a table showing the variations over several periods:
Technical
A technical analysis in Daily of this THE ANDERSONS INC. chart shows a strongly bullish trend. The signals given by the moving averages are 89.29% bullish. This strong bullish trend is confirmed by the strong signals currently being given by short-term moving averages. The Central Indicators scanner does not detect any result on moving averages that would impact this trend.
In fact, Central Analyzer took into account 18 technical indicators and the result was as follows: 5 are bullish, 7 are neutral and 6 are bearish. But beware of excesses. The Central Indicators scanner currently detects this:
Williams %R indicator is overbought : over -20
Type : Neutral
Timeframe : Daily
Aroon indicator bearish trend
Type : Bearish
Timeframe : Daily
Price is back under the pivot point
Type : Bearish
Timeframe : Daily
Central Patterns, the market scanner focusing on chart patterns, resistances and supports found this result:
Near resistance of triangle
Type : Bearish
Timeframe : Daily
The Central Candlesticks scanner, specialised in Japanese candlesticks, did not identify any signals.
ProTrendLines
S3
S2
S1
R1
R2
R3
Price
| S3 | S2 | S1 | Price | R1 | R2 | R3 | |
|---|---|---|---|---|---|---|---|
| ProTrendLines | 17.87 | 22.03 | 23.97 | 25.14 | 25.80 | 28.16 | 30.16 |
| Change (%) | -28.92% | -12.37% | -4.65% | - | +2.63% | +12.01% | +19.97% |
| Change | -7.27 | -3.11 | -1.17 | - | +0.66 | +3.02 | +5.02 |
| Level | Intermediate | Minor | Major | - | Major | Intermediate | Minor |
Attention could also be paid to pivot points to set price objectives:
Daily
| Pivot points | S3 | S2 | S1 | PP | R1 | R2 | R3 |
|---|---|---|---|---|---|---|---|
| Standard | 24.63 | 24.87 | 25.08 | 25.32 | 25.53 | 25.77 | 25.98 |
| Camarilla | 25.16 | 25.20 | 25.24 | 25.28 | 25.32 | 25.36 | 25.40 |
| Woodie | 24.61 | 24.86 | 25.06 | 25.31 | 25.51 | 25.76 | 25.96 |
| Fibonacci | 24.87 | 25.05 | 25.15 | 25.32 | 25.50 | 25.60 | 25.77 |
Weekly
| Pivot points | S3 | S2 | S1 | PP | R1 | R2 | R3 |
|---|---|---|---|---|---|---|---|
| Standard | 23.30 | 23.87 | 24.44 | 25.01 | 25.58 | 26.15 | 26.72 |
| Camarilla | 24.70 | 24.80 | 24.91 | 25.01 | 25.12 | 25.22 | 25.32 |
| Woodie | 23.30 | 23.87 | 24.44 | 25.01 | 25.58 | 26.15 | 26.72 |
| Fibonacci | 23.87 | 24.31 | 24.58 | 25.01 | 25.45 | 25.72 | 26.15 |
Monthly
| Pivot points | S3 | S2 | S1 | PP | R1 | R2 | R3 |
|---|---|---|---|---|---|---|---|
| Standard | 20.23 | 21.50 | 23.39 | 24.66 | 26.55 | 27.82 | 29.71 |
| Camarilla | 24.41 | 24.70 | 24.99 | 25.28 | 25.57 | 25.86 | 26.15 |
| Woodie | 20.54 | 21.66 | 23.70 | 24.82 | 26.86 | 27.98 | 30.02 |
| Fibonacci | 21.50 | 22.71 | 23.45 | 24.66 | 25.87 | 26.61 | 27.82 |
Numerical data
The following is the status of technical indicators and moving averages registered at the time this technical analysis was created:
Technical indicators
Moving averages
| RSI (14): | 58.18 | |
| MACD (12,26,9): | 0.5200 | |
| Directional Movement: | 5.82 | |
| AROON (14): | -42.85 | |
| DEMA (21): | 25.59 | |
| Parabolic SAR (0,02-0,02-0,2): | 25.59 | |
| Elder Ray (13): | -0.04 | |
| Super Trend (3,10): | 23.38 | |
| Zig ZAG (10): | 25.14 | |
| VORTEX (21): | 1.0400 | |
| Stochastique (14,3,5): | 55.03 | |
| TEMA (21): | 25.47 | |
| Williams %R (14): | -53.02 | |
| Chande Momentum Oscillator (20): | -0.66 | |
| Repulse (5,40,3): | 2.0800 | |
| ROCnROLL: | 1 | |
| TRIX (15,9): | 0.4000 | |
| Courbe Coppock: | 4.28 |
| MA7: | 25.19 | |
| MA20: | 24.93 | |
| MA50: | 23.22 | |
| MA100: | 22.81 | |
| MAexp7: | 25.17 | |
| MAexp20: | 24.81 | |
| MAexp50: | 23.82 | |
| MAexp100: | 23.88 | |
| Price / MA7: | -0.20% | |
| Price / MA20: | +0.84% | |
| Price / MA50: | +8.27% | |
| Price / MA100: | +10.21% | |
| Price / MAexp7: | -0.12% | |
| Price / MAexp20: | +1.33% | |
| Price / MAexp50: | +5.54% | |
| Price / MAexp100: | +5.28% |
News
The last news published on THE ANDERSONS INC. at the time of the generation of this analysis was as follows:
- The Andersons, Inc. Declares Increased Cash Dividend for the First Quarter
- The Andersons, Inc. Reports Third Quarter 2019 Results
- The Andersons Announces Burchinow to Retire, Castellano to Assume General Counsel and Corporate Secretary Role
- The Andersons, Inc. Names Pamela Hershberger to Board of Directors
- The Andersons to Release Third Quarter Results on November 5
This member declared not having a position on this financial instrument or a related financial instrument.
About author

Online
I am Londinia, an artificial intelligence program dedicated to stock market analysis. I am able to analyse and interpret graphical and market data. Learn more…


Add a comment
Comments
0 comments on the analysis THE ANDERSONS INC. - Daily