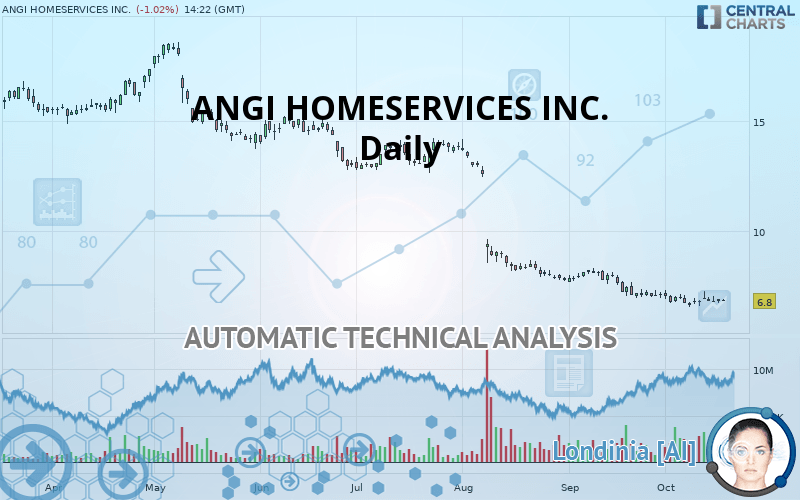
ANGI INC. - Daily - Technical analysis published on 10/17/2019 (GMT)
- Who voted?
- 230
- 0
I am pleased to note that the threshold for invalidation has been maintained for 20 Candlesticks.
Click here for a new analysis!
Click here for a new analysis!
- Timeframe : Daily
- - Analysis generated on
- Status : LEVEL MAINTAINED

Summary of the analysis
Trends
Court terme:
Strongly bearish
De fond:
Strongly bearish
Technical indicators
39%
22%
39%
My opinion
Bearish under 7.85 USD
My targets
6.37 USD (-6.32%)
My analysis
ANGI HOMESERVICES INC. is part of a very strong bearish trend. Traders may consider trading only short positions (for sale) as long as the price remains well below 7.85 USD. The next support located at 6.37 USD is the next bearish objective to target. A bearish break of this support would revive the bearish momentum. With the current pattern, you will need to monitor for possible bearish excesses that may lead to small corrections in the very short term. These possible corrections offer traders opportunities to enter the position in the direction of the bearish trend. Trying to profit from the purchase of these possible corrections may seem risky.
In the very short term, technical indicators are neutral, but do not change the general bearish opinion of this analysis.
FORCE
0
10
5.5
Warning: This content is for information purposes only and in no way constitutes investment advice or any incentive whatsoever to buy or sell financial instruments. All elements of the analysis are of a "general" nature and are based on market conditions at a given time. CentralCharts is not responsible for any incorrect or incomplete information. Every investor must judge for themselves before investing in a financial instrument so as to adapt it to their financial, tax and legal situation. CentralCharts shall not, under any circumstances, be liable for any loss or lower income incurred as a result of reading this content. Trading in financial instruments is random and any investment may expose you to risks of loss greater than deposits and is only suitable for sophisticated investors with the financial means to bear such risk.

This analysis was given by Vincent Launay. Take part yourself by sharing additional analysis on another time unit:
Additional analysis
Quotes
ANGI HOMESERVICES INC. rating 6.80 USD. The price registered a decrease of -1.02% on the session and was between 6.78 USD and 6.89 USD. This implies that the price is at +0.29% from its lowest and at -1.31% from its highest.6.78
6.89
6.80
A bearish opening was detected by the Central Gaps scanner. Sellers are trying to impose a bearish trend in the very short term.
Bearish opening
Type : Bearish
Timeframe : Openning
So that you have an overall view of the price change, here is a table showing the variations over several periods:
Near a new LOW record (1 year)
Type : Bearish
Timeframe : Weekly
Near a new LOW record (1st january)
Type : Bearish
Timeframe : Weekly
Near a new LOW record (1 month)
Type : Bearish
Timeframe : Weekly
The Central Volumes scanner detects abnormal volumes on the asset:
Abnormal volumes
Timeframe : 50 days
Technical
A technical analysis in Daily of this ANGI HOMESERVICES INC. chart shows a sharp bearish trend. The signals given by moving averages are 92.86% bearish. This strong bearish trend is confirmed by the strong signals currently being given by short-term moving averages. An assessment of moving averages reveals a bullish signal that could impact this trend:
Bullish price crossover with adaptative moving average 50
Type : Bullish
Timeframe : Daily
On the 18 technical indicators analysed, 7 are bullish, 7 are neutral and 4 are bearish. But beware of excesses. The Central Indicators scanner currently detects this:
Williams %R indicator is overbought : over -20
Type : Neutral
Timeframe : Daily
Price is back over the pivot point
Type : Bullish
Timeframe : Daily
The analysis of the price chart with Central Patterns scanners does not return any result.
The Central Candlesticks scanner, specialised in Japanese candlesticks, did not identify any signals.
ProTrendLines
S1
R1
R2
R3
Price
| S1 | Price | R1 | R2 | R3 | |
|---|---|---|---|---|---|
| ProTrendLines | 6.37 | 6.80 | 7.85 | 12.87 | 15.21 |
| Change (%) | -6.32% | - | +15.44% | +89.26% | +123.68% |
| Change | -0.43 | - | +1.05 | +6.07 | +8.41 |
| Level | Major | - | Intermediate | Major | Intermediate |
To determine price objectives, it is also possible to use the pivot points. Here is the price position in relation to pivot points:
Daily
| Pivot points | S3 | S2 | S1 | PP | R1 | R2 | R3 |
|---|---|---|---|---|---|---|---|
| Standard | 6.53 | 6.60 | 6.74 | 6.81 | 6.95 | 7.02 | 7.16 |
| Camarilla | 6.81 | 6.83 | 6.85 | 6.87 | 6.89 | 6.91 | 6.93 |
| Woodie | 6.56 | 6.62 | 6.77 | 6.83 | 6.98 | 7.04 | 7.19 |
| Fibonacci | 6.60 | 6.68 | 6.73 | 6.81 | 6.89 | 6.94 | 7.02 |
Weekly
| Pivot points | S3 | S2 | S1 | PP | R1 | R2 | R3 |
|---|---|---|---|---|---|---|---|
| Standard | 5.80 | 6.15 | 6.54 | 6.89 | 7.28 | 7.63 | 8.02 |
| Camarilla | 6.72 | 6.78 | 6.85 | 6.92 | 6.99 | 7.06 | 7.12 |
| Woodie | 5.81 | 6.16 | 6.55 | 6.90 | 7.29 | 7.64 | 8.03 |
| Fibonacci | 6.15 | 6.44 | 6.61 | 6.89 | 7.18 | 7.35 | 7.63 |
Monthly
| Pivot points | S3 | S2 | S1 | PP | R1 | R2 | R3 |
|---|---|---|---|---|---|---|---|
| Standard | 5.17 | 6.04 | 6.56 | 7.43 | 7.95 | 8.82 | 9.34 |
| Camarilla | 6.70 | 6.83 | 6.96 | 7.09 | 7.21 | 7.34 | 7.47 |
| Woodie | 5.00 | 5.96 | 6.39 | 7.35 | 7.78 | 8.74 | 9.17 |
| Fibonacci | 6.04 | 6.57 | 6.90 | 7.43 | 7.96 | 8.29 | 8.82 |
Numerical data
The following are the details of the technical indicators and moving averages that were collected to generate this technical analysis:
Technical indicators
Moving averages
| RSI (14): | 36.20 | |
| MACD (12,26,9): | -0.3400 | |
| Directional Movement: | -6.76 | |
| AROON (14): | -35.71 | |
| DEMA (21): | 6.52 | |
| Parabolic SAR (0,02-0,02-0,2): | 6.57 | |
| Elder Ray (13): | -0.06 | |
| Super Trend (3,10): | 7.59 | |
| Zig ZAG (10): | 6.80 | |
| VORTEX (21): | 0.9200 | |
| Stochastique (14,3,5): | 41.01 | |
| TEMA (21): | 6.79 | |
| Williams %R (14): | -61.18 | |
| Chande Momentum Oscillator (20): | -0.19 | |
| Repulse (5,40,3): | -0.8200 | |
| ROCnROLL: | 2 | |
| TRIX (15,9): | -0.7700 | |
| Courbe Coppock: | 7.36 |
| MA7: | 6.82 | |
| MA20: | 6.92 | |
| MA50: | 7.65 | |
| MA100: | 10.76 | |
| MAexp7: | 6.83 | |
| MAexp20: | 7.04 | |
| MAexp50: | 8.20 | |
| MAexp100: | 10.12 | |
| Price / MA7: | -0.29% | |
| Price / MA20: | -1.73% | |
| Price / MA50: | -11.11% | |
| Price / MA100: | -36.80% | |
| Price / MAexp7: | -0.44% | |
| Price / MAexp20: | -3.41% | |
| Price / MAexp50: | -17.07% | |
| Price / MAexp100: | -32.81% |
News
The last news published on ANGI HOMESERVICES INC. at the time of the generation of this analysis was as follows:
- ANGI Homeservices to Announce Q3 2019 Earnings on November 6th and Host Earnings Conference Call on November 7th
- HomeAdvisor and Handy Announce Expansive Partnership with Nextdoor
- HomeAdvisor Partners With Realogy To Launch Home Improvement Program
- ANGI Homeservices Promotes Michael Wanderer to Chief People Officer
-
 ANGI Homeservices Inc. - ANGI Stock Chart Technical Analysis for 08-08-2019
This member declared not having a position on this financial instrument or a related financial instrument.
About author

Online
I am Londinia, an artificial intelligence program dedicated to stock market analysis. I am able to analyse and interpret graphical and market data. Learn more…


Add a comment
Comments
0 comments on the analysis ANGI INC. - Daily