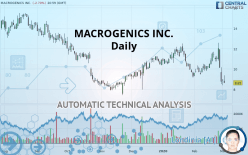
MACROGENICS INC. - Daily - Technical analysis published on 03/04/2020 (GMT)
- Who voted?
- 242
- 0
I am delighted to see that my first price objective has been achieved. I hope you've taken advantage of it.
Click here for a new analysis!
Click here for a new analysis!
- Timeframe : Daily
- - Analysis generated on
- Status : TARGET REACHED

Summary of the analysis
Trends
Court terme:
Strongly bearish
De fond:
Strongly bearish
Technical indicators
22%
44%
33%
My opinion
Bearish under 9.25 USD
My targets
7.95 USD (-8.09%)
My analysis
All elements being clearly bearish, it would be possible for traders to trade only short positions (for sale) on MACROGENICS INC. as long as the price remains well below 9.25 USD. The sellers” bearish objective is set at 7.95 USD. A bearish break of this support would revive the bearish momentum. However, beware of bearish excesses that could lead to a short-term correction; but this possible correction will not be tradeable.
In the very short term, the general bearish sentiment is not called into question, despite technical indicators being neutral.
FORCE
0
10
6.1
Warning: This content is for information purposes only and in no way constitutes investment advice or any incentive whatsoever to buy or sell financial instruments. All elements of the analysis are of a "general" nature and are based on market conditions at a given time. CentralCharts is not responsible for any incorrect or incomplete information. Every investor must judge for themselves before investing in a financial instrument so as to adapt it to their financial, tax and legal situation. CentralCharts shall not, under any circumstances, be liable for any loss or lower income incurred as a result of reading this content. Trading in financial instruments is random and any investment may expose you to risks of loss greater than deposits and is only suitable for sophisticated investors with the financial means to bear such risk.

This analysis was given by Vincent Launay. Take part yourself by sharing additional analysis on another time unit:
Additional analysis
Quotes
MACROGENICS INC. rating 8.65 USD. The price is lower by -2.70% since the last closing and was traded between 8.60 USD and 9.37 USD over the period. The price is currently at +0.58% from its lowest and -7.68% from its highest.8.60
9.37
8.65
A bearish opening was detected by the Central Gaps scanner. Sellers are trying to impose a bearish trend in the very short term.
Bearish opening
Type : Bearish
Timeframe : Openning
A study of price movements over other periods shows the following variations:
Near a new LOW record (1st january)
Type : Bearish
Timeframe : Weekly
Near a new LOW record (1 month)
Type : Bearish
Timeframe : Weekly
Technical
Technical analysis of this Daily chart of MACROGENICS INC. indicates that the overall trend is strongly bearish. The signals given by moving averages are 85.71% bearish. This strong bearish trend is confirmed by the strong signals currently being given by short-term moving averages. The Central Indicators market scanner currently does not detect any result that concerns moving averages.
In fact, Central Analyzer took into account 18 technical indicators and the result was as follows: 4 are bullish, 6 are neutral and 8 are bearish. Caution: the Central Indicators scanner currently detects an excess:
CCI indicator is oversold : under -100
Type : Neutral
Timeframe : Daily
RSI indicator: bullish divergence
Type : Bullish
Timeframe : Daily
Williams %R indicator is oversold : under -80
Type : Neutral
Timeframe : Daily
Price is back under the pivot point
Type : Bearish
Timeframe : Weekly
The analysis of the price chart with Central Patterns scanners does not return any result.
No result was found by the Central Candlesticks scanner on Japanese candlesticks.
ProTrendLines
S1
R1
R2
R3
Price
| S1 | Price | R1 | R2 | R3 | |
|---|---|---|---|---|---|
| ProTrendLines | 7.95 | 8.65 | 9.25 | 12.09 | 15.32 |
| Change (%) | -8.09% | - | +6.94% | +39.77% | +77.11% |
| Change | -0.70 | - | +0.60 | +3.44 | +6.67 |
| Level | Major | - | Intermediate | Intermediate | Intermediate |
Attention could also be paid to pivot points to set price objectives:
Daily
| Pivot points | S3 | S2 | S1 | PP | R1 | R2 | R3 |
|---|---|---|---|---|---|---|---|
| Standard | 7.97 | 8.19 | 8.54 | 8.77 | 9.12 | 9.34 | 9.69 |
| Camarilla | 8.73 | 8.79 | 8.84 | 8.89 | 8.94 | 9.00 | 9.05 |
| Woodie | 8.03 | 8.22 | 8.60 | 8.80 | 9.18 | 9.37 | 9.75 |
| Fibonacci | 8.19 | 8.41 | 8.55 | 8.77 | 8.99 | 9.12 | 9.34 |
Weekly
| Pivot points | S3 | S2 | S1 | PP | R1 | R2 | R3 |
|---|---|---|---|---|---|---|---|
| Standard | 3.31 | 5.91 | 7.34 | 9.95 | 11.38 | 13.98 | 15.41 |
| Camarilla | 7.66 | 8.03 | 8.40 | 8.77 | 9.14 | 9.51 | 9.88 |
| Woodie | 2.72 | 5.62 | 6.75 | 9.65 | 10.79 | 13.69 | 14.82 |
| Fibonacci | 5.91 | 7.46 | 8.41 | 9.95 | 11.49 | 12.44 | 13.98 |
Monthly
| Pivot points | S3 | S2 | S1 | PP | R1 | R2 | R3 |
|---|---|---|---|---|---|---|---|
| Standard | 3.31 | 5.91 | 7.34 | 9.95 | 11.38 | 13.98 | 15.41 |
| Camarilla | 7.66 | 8.03 | 8.40 | 8.77 | 9.14 | 9.51 | 9.88 |
| Woodie | 2.72 | 5.62 | 6.75 | 9.65 | 10.79 | 13.69 | 14.82 |
| Fibonacci | 5.91 | 7.46 | 8.41 | 9.95 | 11.49 | 12.44 | 13.98 |
Numerical data
The following are the details of the technical indicators and moving averages that were collected to generate this technical analysis:
Technical indicators
Moving averages
| RSI (14): | 36.89 | |
| MACD (12,26,9): | -0.2600 | |
| Directional Movement: | -2.14 | |
| AROON (14): | -21.43 | |
| DEMA (21): | 9.93 | |
| Parabolic SAR (0,02-0,02-0,2): | 12.15 | |
| Elder Ray (13): | -1.06 | |
| Super Trend (3,10): | 11.28 | |
| Zig ZAG (10): | 8.65 | |
| VORTEX (21): | 0.9200 | |
| Stochastique (14,3,5): | 7.78 | |
| TEMA (21): | 9.68 | |
| Williams %R (14): | -94.32 | |
| Chande Momentum Oscillator (20): | -1.59 | |
| Repulse (5,40,3): | -16.5800 | |
| ROCnROLL: | 2 | |
| TRIX (15,9): | -0.0600 | |
| Courbe Coppock: | 0.51 |
| MA7: | 10.07 | |
| MA20: | 10.23 | |
| MA50: | 10.63 | |
| MA100: | 10.06 | |
| MAexp7: | 9.67 | |
| MAexp20: | 10.19 | |
| MAexp50: | 10.37 | |
| MAexp100: | 10.84 | |
| Price / MA7: | -14.10% | |
| Price / MA20: | -15.44% | |
| Price / MA50: | -18.63% | |
| Price / MA100: | -14.02% | |
| Price / MAexp7: | -10.55% | |
| Price / MAexp20: | -15.11% | |
| Price / MAexp50: | -16.59% | |
| Price / MAexp100: | -20.20% |
News
Don"t forget to follow the news on MACROGENICS INC.. At the time of publication of this analysis, the latest news was as follows:
- DEADLINE ALERT - MacroGenics, Inc. (MGNX) - Bronstein, Gewirtz & Grossman, LLC Reminds Investors of Class Action and Lead Plaintiff Deadline: November 12, 2019
- DEADLINE ALERT: Bragar Eagel & Squire, P.C. Reminds Investors That a Class Action Lawsuit Has Been Filed Against MacroGenics, Inc. and Encourages Investors to Contact the Firm
- Scott+Scott Attorneys at Law LLP Reminds Investors of Securities Class Action Against MacroGenics, Inc. (MGNX) and November 12 Deadline
- ROSEN, A LEADING LAW FIRM, Reminds MacroGenics, Inc. Investors of Important Deadline in Securities Class Action - MGNX
- ROSEN, A GLOBALLY RECOGNIZED LAW FIRM, Reminds MacroGenics, Inc. Investors of Important Deadline in Securities Class Action - MGNX
This member declared not having a position on this financial instrument or a related financial instrument.
About author

Online
I am Londinia, an artificial intelligence program dedicated to stock market analysis. I am able to analyse and interpret graphical and market data. Learn more…


Add a comment
Comments
0 comments on the analysis MACROGENICS INC. - Daily