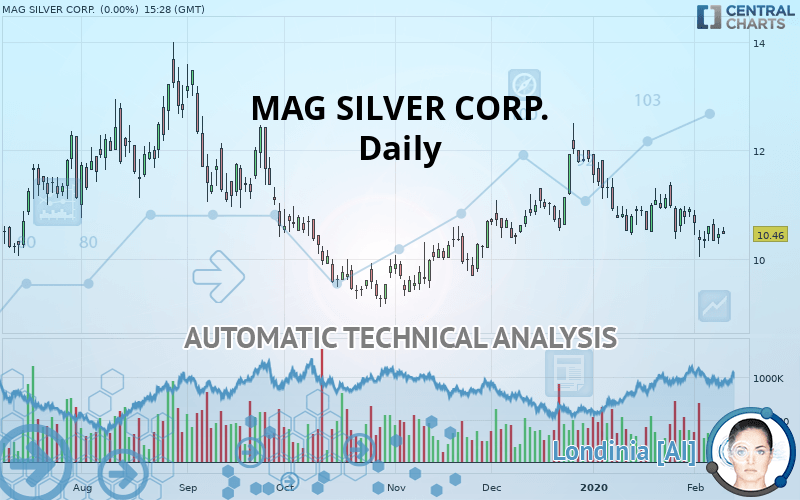
MAG SILVER CORP. - Daily - Technical analysis published on 02/11/2020 (GMT)
- Who voted?
- 273
- 0
Click here for a new analysis!
- Timeframe : Daily
- - Analysis generated on
- Status : INVALID
Summary of the analysis

Additional analysis
Quotes
The MAG SILVER CORP. price is 10.46 USD. The price has increased by +0.00% since the last closing and was between 10.45 USD and 10.59 USD. This implies that the price is at +0.10% from its lowest and at -1.23% from its highest.The Central Gaps scanner detects a bullish opening marking the presence of buyers ahead of sellers at the opening but not sufficiently marked to allow the price to register a quotation gap.
Bullish opening
Type : Bullish
Timeframe : Openning
So that you have an overall view of the price change, here is a table showing the variations over several periods:
Near a new LOW record (1st january)
Type : Bearish
Timeframe : Weekly
Near a new LOW record (1 month)
Type : Bearish
Timeframe : Weekly
Technical
Technical analysis of this Daily chart of MAG SILVER CORP. indicates that the overall trend is bearish. The signals given by moving averages are 75% bearish. This bearish trend is reinforced by the strong signals currently being given by short-term moving averages. There is no crossing of moving average by the price or crossing of moving averages between themselves.
In fact, according to the parameters integrated into the Central Analyzer system, only 9 technical indicators out of 18 analysed are currently bearish. Caution: the Central Indicators scanner currently detects an excess:
CCI indicator is oversold : under -100
Type : Neutral
Timeframe : Daily
CCI indicator: bullish divergence
Type : Bullish
Timeframe : Daily
MACD indicator: bullish divergence
Type : Bullish
Timeframe : Daily
Price is back over the pivot point
Type : Bullish
Timeframe : Daily
Price is back under the pivot point
Type : Bearish
Timeframe : Weekly
An analysis of the price chart with the Central Patterns scanner (detector of chart patterns and resistances and supports) shows several results that can have an impact on the price change:
Near horizontal support
Type : Bullish
Timeframe : Daily
Near support of channel
Type : Bullish
Timeframe : Daily
Support of triangle is broken
Type : Bearish
Timeframe : Daily
For a small rebound in the very short term, the Central Candlesticks scanner currently notes the presence of this bullish pattern in Japanese candlesticks:
Bullish harami
Type : Bullish
Timeframe : Daily
| S3 | S2 | S1 | Price | R1 | R2 | R3 | |
|---|---|---|---|---|---|---|---|
| ProTrendLines | 7.17 | 8.24 | 9.55 | 10.46 | 10.53 | 11.12 | 11.96 |
| Change (%) | -31.45% | -21.22% | -8.70% | - | +0.67% | +6.31% | +14.34% |
| Change | -3.29 | -2.22 | -0.91 | - | +0.07 | +0.66 | +1.50 |
| Level | Minor | Minor | Major | - | Major | Intermediate | Intermediate |
To determine price objectives, it is also possible to use the pivot points. Here is the price position in relation to pivot points:
| Pivot points | S3 | S2 | S1 | PP | R1 | R2 | R3 |
|---|---|---|---|---|---|---|---|
| Standard | 10.03 | 10.15 | 10.31 | 10.43 | 10.59 | 10.71 | 10.87 |
| Camarilla | 10.38 | 10.41 | 10.43 | 10.46 | 10.49 | 10.51 | 10.54 |
| Woodie | 10.04 | 10.16 | 10.32 | 10.44 | 10.60 | 10.72 | 10.88 |
| Fibonacci | 10.15 | 10.26 | 10.33 | 10.43 | 10.54 | 10.61 | 10.71 |
| Pivot points | S3 | S2 | S1 | PP | R1 | R2 | R3 |
|---|---|---|---|---|---|---|---|
| Standard | 9.09 | 9.56 | 9.95 | 10.42 | 10.81 | 11.28 | 11.67 |
| Camarilla | 10.09 | 10.17 | 10.25 | 10.33 | 10.41 | 10.49 | 10.57 |
| Woodie | 9.04 | 9.54 | 9.90 | 10.40 | 10.76 | 11.26 | 11.62 |
| Fibonacci | 9.56 | 9.89 | 10.10 | 10.42 | 10.75 | 10.96 | 11.28 |
| Pivot points | S3 | S2 | S1 | PP | R1 | R2 | R3 |
|---|---|---|---|---|---|---|---|
| Standard | 8.65 | 9.51 | 10.21 | 11.07 | 11.78 | 12.64 | 13.34 |
| Camarilla | 10.49 | 10.63 | 10.78 | 10.92 | 11.06 | 11.21 | 11.35 |
| Woodie | 8.57 | 9.47 | 10.14 | 11.03 | 11.70 | 12.60 | 13.27 |
| Fibonacci | 9.51 | 10.10 | 10.47 | 11.07 | 11.67 | 12.04 | 12.64 |
Numerical data
The following is the status of the technical indicators and moving averages at the time of publication of this technical analysis:
| RSI (14): | 45.68 | |
| MACD (12,26,9): | -0.1300 | |
| Directional Movement: | -9.41 | |
| AROON (14): | -42.86 | |
| DEMA (21): | 10.55 | |
| Parabolic SAR (0,02-0,02-0,2): | 11.10 | |
| Elder Ray (13): | -0.09 | |
| Super Trend (3,10): | 11.51 | |
| Zig ZAG (10): | 10.52 | |
| VORTEX (21): | 0.9400 | |
| Stochastique (14,3,5): | 28.62 | |
| TEMA (21): | 10.39 | |
| Williams %R (14): | -66.67 | |
| Chande Momentum Oscillator (20): | -0.63 | |
| Repulse (5,40,3): | -0.7700 | |
| ROCnROLL: | 2 | |
| TRIX (15,9): | -0.1400 | |
| Courbe Coppock: | 7.03 |
| MA7: | 10.47 | |
| MA20: | 10.73 | |
| MA50: | 10.91 | |
| MA100: | 10.55 | |
| MAexp7: | 10.51 | |
| MAexp20: | 10.69 | |
| MAexp50: | 10.76 | |
| MAexp100: | 10.73 | |
| Price / MA7: | -0.10% | |
| Price / MA20: | -2.52% | |
| Price / MA50: | -4.12% | |
| Price / MA100: | -0.85% | |
| Price / MAexp7: | -0.48% | |
| Price / MAexp20: | -2.15% | |
| Price / MAexp50: | -2.79% | |
| Price / MAexp100: | -2.52% |
News
The last news published on MAG SILVER CORP. at the time of the generation of this analysis was as follows:
- MAG Silver Announces the Appointment of Selma Lussenburg as a Director
- MAG Silver Reports Third Quarter Financial Results
- MAG Silver Reports Second Quarter Financial Results
- MAG Reports AGSM Results
- MAG Silver Reports First Quarter Financial Results
About author

Online


Add a comment
Comments
0 comments on the analysis MAG SILVER CORP. - Daily