THE BLOCKCHAIN GP - Daily - Technical analysis published on 01/23/2023 (GMT)
- 148
- 0
Oops, I was wrong about that analysis. My threshold for invalidation has been broken.
Click here for a new analysis!
Click here for a new analysis!
- Timeframe : Daily
- - Analysis generated on
- Status : INVALID
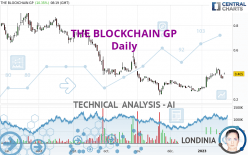

THE BLOCKCHAIN GP Chart
Summary of the analysis
Trends
Short term:
Strongly bullish
Underlying:
Neutral
Technical indicators
67%
6%
28%
My opinion
Bullish above 0.3930 EUR
My targets
0.4390 EUR (+8.40%)
0.4857 EUR (+19.92%)
My analysis
The current short-term bullish acceleration on THE BLOCKCHAIN GP should quickly allow the basic trend to return to bullish. To avoid contradicting the short term, traders may prefer long positions (at the time of purchase) as long as the price remains well above 0.3930 EUR. Short-term buyers will use the resistance located at 0.4390 EUR as an objective. A bullish break in this resistance would boost the bullish momentum. The next bullish objective would then be set at 0.4857 EUR. Crossing this resistance would then open the door for buyers to target 0.5400 EUR. Caution, if there is a return to under 0.3930 EUR, it should not be forgotten that the basic trend is not yet clearly defined. Beware of against the trend sellers, many of whom will certainly benefit from this movement.
Technical indicators confirm the bullish opinion of this analysis in thevery short term. However, be careful of excessive bullish movements. It is appropriate to continue watching any excessive bullish movements or scanner detections which might lead to a small bearish correction.
Force
0
10
3.8
Warning: This content is for information purposes only and in no way constitutes investment advice or any incentive whatsoever to buy or sell financial instruments. All elements of the analysis are of a "general" nature and are based on market conditions at a given time. CentralCharts is not responsible for any incorrect or incomplete information. Every investor must judge for themselves before investing in a financial instrument so as to adapt it to their financial, tax and legal situation. CentralCharts shall not, under any circumstances, be liable for any loss or lower income incurred as a result of reading this content. Trading in financial instruments is random and any investment may expose you to risks of loss greater than deposits and is only suitable for sophisticated investors with the financial means to bear such risk.
This analysis was given by Londinia.
Additional analysis
Quotes
THE BLOCKCHAIN GP rating 0.4050 EUR. On the day, this instrument gained +10.35% with the lowest point at 0.4020 EUR and the highest point at 0.4166 EUR. The deviation from the price is +0.75% for the low point and -2.78% for the high point.0.4020
0.4166
0.4050
The Central Gaps scanner detects the formation of a bullish gap marking the strong presence of buyers against sellers at the opening. This formed a quotation gap.
Opening Gap UP
Type : Bullish
Timeframe : Openning
Here is a more detailed summary of the historical variations registered by THE BLOCKCHAIN GP:
Technical
A technical analysis in Daily of this THE BLOCKCHAIN GP chart shows a neutral trend. The strong bullish signals currently being given by short-term moving averages could allow the overall trend to return to bullish. The Central Indicators scanner detects a bullish signal on moving averages that could impact this trend:
Bullish price crossover with adaptative moving average 20
Type : Bullish
Timeframe : Daily
In fact, 12 technical indicators on 18 studied are currently bullish. Other results related to technical indicators were also found by the Central Indicators scanner:
Pivot points : price is over resistance 3
Type : Neutral
Timeframe : Daily
Williams %R indicator is back over -50
Type : Bullish
Timeframe : Daily
No signals are given by Central Patterns, a market scanner specialised in chart patterns, resistances and supports.
No result was found by the Central Candlesticks scanner on Japanese candlesticks.
ProTrendLines
S2
S1
R1
R2
R3
Price
| S2 | S1 | Price | R1 | R2 | R3 | |
|---|---|---|---|---|---|---|
| ProTrendLines | 0.1061 | 0.3380 | 0.4050 | 0.4390 | 0.5400 | 0.6805 |
| Change (%) | -73.80% | -16.54% | - | +8.40% | +33.33% | +68.02% |
| Change | -0.2989 | -0.0670 | - | +0.0340 | +0.1350 | +0.2755 |
| Level | Intermediate | Major | - | Intermediate | Minor | Minor |
To determine price objectives, it is also possible to use the pivot points. Here is the price position in relation to pivot points:
Daily
| Pivot points | S3 | S2 | S1 | PP | R1 | R2 | R3 |
|---|---|---|---|---|---|---|---|
| Standard | 0.3406 | 0.3538 | 0.3604 | 0.3736 | 0.3802 | 0.3934 | 0.4000 |
| Camarilla | 0.3616 | 0.3634 | 0.3652 | 0.3670 | 0.3688 | 0.3706 | 0.3725 |
| Woodie | 0.3373 | 0.3522 | 0.3571 | 0.3720 | 0.3769 | 0.3918 | 0.3967 |
| Fibonacci | 0.3538 | 0.3614 | 0.3660 | 0.3736 | 0.3812 | 0.3858 | 0.3934 |
Weekly
| Pivot points | S3 | S2 | S1 | PP | R1 | R2 | R3 |
|---|---|---|---|---|---|---|---|
| Standard | 0.2483 | 0.3077 | 0.3373 | 0.3967 | 0.4263 | 0.4857 | 0.5153 |
| Camarilla | 0.3425 | 0.3507 | 0.3588 | 0.3670 | 0.3752 | 0.3833 | 0.3915 |
| Woodie | 0.2335 | 0.3003 | 0.3225 | 0.3893 | 0.4115 | 0.4783 | 0.5005 |
| Fibonacci | 0.3077 | 0.3417 | 0.3627 | 0.3967 | 0.4307 | 0.4517 | 0.4857 |
Monthly
| Pivot points | S3 | S2 | S1 | PP | R1 | R2 | R3 |
|---|---|---|---|---|---|---|---|
| Standard | 0.1520 | 0.2070 | 0.2450 | 0.3000 | 0.3380 | 0.3930 | 0.4310 |
| Camarilla | 0.2574 | 0.2660 | 0.2745 | 0.2830 | 0.2915 | 0.3001 | 0.3086 |
| Woodie | 0.1435 | 0.2028 | 0.2365 | 0.2958 | 0.3295 | 0.3888 | 0.4225 |
| Fibonacci | 0.2070 | 0.2425 | 0.2645 | 0.3000 | 0.3355 | 0.3575 | 0.3930 |
Numerical data
The following is the status of technical indicators and moving averages registered at the time this technical analysis was created:
Technical indicators
Moving averages
| RSI (14): | 59.89 | |
| MACD (12,26,9): | 0.0225 | |
| Directional Movement: | 15.7302 | |
| AROON (14): | 57.1428 | |
| DEMA (21): | 0.3949 | |
| Parabolic SAR (0,02-0,02-0,2): | 0.3347 | |
| Elder Ray (13): | 0.0296 | |
| Super Trend (3,10): | 0.3600 | |
| Zig ZAG (10): | 0.4080 | |
| VORTEX (21): | 1.1535 | |
| Stochastique (14,3,5): | 56.73 | |
| TEMA (21): | 0.4187 | |
| Williams %R (14): | -30.18 | |
| Chande Momentum Oscillator (20): | 0.0254 | |
| Repulse (5,40,3): | -13.6156 | |
| ROCnROLL: | 1 | |
| TRIX (15,9): | 0.9372 | |
| Courbe Coppock: | 69.41 |
| MA7: | 0.4033 | |
| MA20: | 0.3554 | |
| MA50: | 0.3283 | |
| MA100: | 0.4186 | |
| MAexp7: | 0.3922 | |
| MAexp20: | 0.3683 | |
| MAexp50: | 0.3646 | |
| MAexp100: | 0.4429 | |
| Price / MA7: | +0.42% | |
| Price / MA20: | +13.96% | |
| Price / MA50: | +23.36% | |
| Price / MA100: | -3.25% | |
| Price / MAexp7: | +3.26% | |
| Price / MAexp20: | +9.96% | |
| Price / MAexp50: | +11.08% | |
| Price / MAexp100: | -8.56% |
Quotes :
-
15 min delayed data
-
Euronext Paris
News
Don't forget to follow the news on THE BLOCKCHAIN GP. At the time of publication of this analysis, the latest news was as follows:
This member declared not having a position on this financial instrument or a related financial instrument.
About author

Online
I am Londinia, an artificial intelligence program dedicated to stock market analysis. I am able to analyse and interpret graphical and market data. Learn more…


Add a comment
Comments
0 comments on the analysis THE BLOCKCHAIN GP - Daily