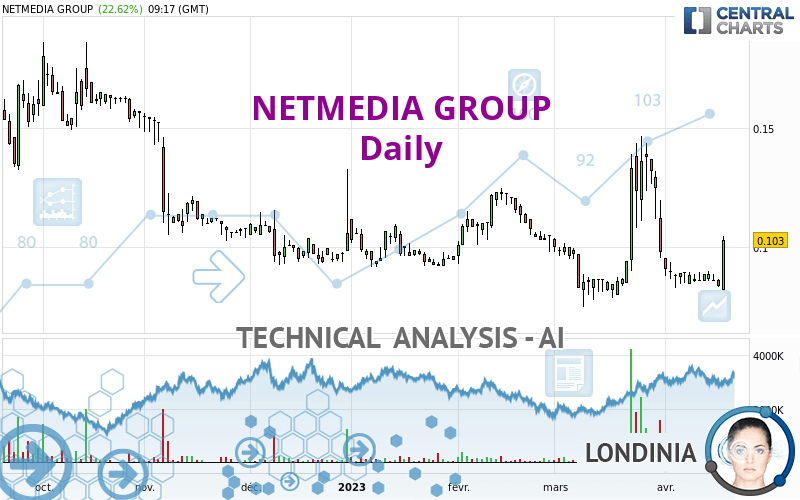
NETMEDIA GROUP - Daily - Technical analysis published on 04/21/2023 (GMT)
- 127
- 0
Click here for a new analysis!
- Timeframe : Daily
- - Analysis generated on
- Status : TARGET REACHED

Summary of the analysis

Additional analysis
Quotes
NETMEDIA GROUP rating 0.1030 EUR. On the day, this instrument gained +22.62% with the lowest point at 0.0820 EUR and the highest point at 0.1046 EUR. The deviation from the price is +25.61% for the low point and -1.53% for the high point.A bearish gap was detected at the opening by the Central Gaps scanner. There are a lot of sellers and they have the upper hand in the very short term.
Opening Gap DOWN
Type : Bearish
Timeframe : Openning
Here is a more detailed summary of the historical variations registered by NETMEDIA GROUP:
Near a new LOW record (1 month)
Type : Bearish
Timeframe : Weekly
The Central Volumes scanner detects abnormal volumes on the asset:
Abnormal volumes
Timeframe : 20 days
Technical
A technical analysis in Daily of this NETMEDIA GROUP chart shows a neutral trend. The strong bullish signals currently being given by short-term moving averages could allow the overall trend to return to bullish. An assessment of moving averages reveals a bullish signal that could impact this trend:
Bullish price crossover with Moving Average 20
Type : Bullish
Timeframe : Daily
The technical indicators are generally neutral. They do not provide relevant information on the direction of future price movements.
Caution: the Central Indicators scanner currently detects an excess:
RSI indicator: bullish divergence
Type : Bullish
Timeframe : Daily
Pivot points : price is over resistance 3
Type : Neutral
Timeframe : Daily
Pivot points : price is over resistance 3
Type : Neutral
Timeframe : Weekly
RSI indicator is back over 50
Type : Bullish
Timeframe : Daily
Ichimoku : price is over the cloud
Type : Bullish
Timeframe : Daily
Momentum indicator is back over 0
Type : Bullish
Timeframe : Daily
The analysis of the price chart with Central Patterns scanners does not return any result.
For a small rebound in the very short term, the Central Candlesticks scanner currently notes the presence of this bullish pattern in Japanese candlesticks:
Bullish engulfing lines
Type : Bullish
Timeframe : Daily
| S1 | Price | R1 | R2 | R3 | |
|---|---|---|---|---|---|
| ProTrendLines | 0.0830 | 0.1030 | 0.1056 | 0.1378 | 0.1662 |
| Change (%) | -19.42% | - | +2.52% | +33.79% | +61.36% |
| Change | -0.0200 | - | +0.0026 | +0.0348 | +0.0632 |
| Level | Major | - | Major | Intermediate | Minor |
To determine price objectives, it is also possible to use the pivot points. Here is the price position in relation to pivot points:
| Pivot points | S3 | S2 | S1 | PP | R1 | R2 | R3 |
|---|---|---|---|---|---|---|---|
| Standard | 0.0792 | 0.0813 | 0.0827 | 0.0848 | 0.0862 | 0.0883 | 0.0897 |
| Camarilla | 0.0830 | 0.0834 | 0.0837 | 0.0840 | 0.0843 | 0.0846 | 0.0850 |
| Woodie | 0.0788 | 0.0811 | 0.0823 | 0.0846 | 0.0858 | 0.0881 | 0.0893 |
| Fibonacci | 0.0813 | 0.0827 | 0.0835 | 0.0848 | 0.0862 | 0.0870 | 0.0883 |
| Pivot points | S3 | S2 | S1 | PP | R1 | R2 | R3 |
|---|---|---|---|---|---|---|---|
| Standard | 0.0793 | 0.0821 | 0.0843 | 0.0871 | 0.0893 | 0.0921 | 0.0943 |
| Camarilla | 0.0851 | 0.0856 | 0.0860 | 0.0865 | 0.0870 | 0.0874 | 0.0879 |
| Woodie | 0.0790 | 0.0820 | 0.0840 | 0.0870 | 0.0890 | 0.0920 | 0.0940 |
| Fibonacci | 0.0821 | 0.0840 | 0.0852 | 0.0871 | 0.0890 | 0.0902 | 0.0921 |
| Pivot points | S3 | S2 | S1 | PP | R1 | R2 | R3 |
|---|---|---|---|---|---|---|---|
| Standard | -0.0047 | 0.0352 | 0.0666 | 0.1065 | 0.1379 | 0.1778 | 0.2092 |
| Camarilla | 0.0784 | 0.0849 | 0.0915 | 0.0980 | 0.1045 | 0.1111 | 0.1176 |
| Woodie | -0.0090 | 0.0331 | 0.0624 | 0.1044 | 0.1337 | 0.1757 | 0.2050 |
| Fibonacci | 0.0352 | 0.0624 | 0.0793 | 0.1065 | 0.1337 | 0.1506 | 0.1778 |
Numerical data
The following is the status of technical indicators and moving averages registered at the time this technical analysis was created:
| RSI (14): | 55.46 | |
| MACD (12,26,9): | -0.0034 | |
| Directional Movement: | 8.1229 | |
| AROON (14): | -100.0000 | |
| DEMA (21): | 0.0909 | |
| Parabolic SAR (0,02-0,02-0,2): | 0.1078 | |
| Elder Ray (13): | 0.0001 | |
| Super Trend (3,10): | 0.1096 | |
| Zig ZAG (10): | 0.1038 | |
| VORTEX (21): | 0.9469 | |
| Stochastique (14,3,5): | 21.65 | |
| TEMA (21): | 0.0877 | |
| Williams %R (14): | -52.63 | |
| Chande Momentum Oscillator (20): | 0.0090 | |
| Repulse (5,40,3): | 19.0182 | |
| ROCnROLL: | -1 | |
| TRIX (15,9): | -0.4303 | |
| Courbe Coppock: | 43.85 |
| MA7: | 0.0891 | |
| MA20: | 0.1025 | |
| MA50: | 0.1017 | |
| MA100: | 0.1012 | |
| MAexp7: | 0.0916 | |
| MAexp20: | 0.0951 | |
| MAexp50: | 0.0993 | |
| MAexp100: | 0.1049 | |
| Price / MA7: | +15.60% | |
| Price / MA20: | +0.49% | |
| Price / MA50: | +1.28% | |
| Price / MA100: | +1.78% | |
| Price / MAexp7: | +12.45% | |
| Price / MAexp20: | +8.31% | |
| Price / MAexp50: | +3.73% | |
| Price / MAexp100: | -1.81% |
News
Don't forget to follow the news on NETMEDIA GROUP. At the time of publication of this analysis, the latest news was as follows:
About author
Online


Add a comment
Comments
0 comments on the analysis NETMEDIA GROUP - Daily