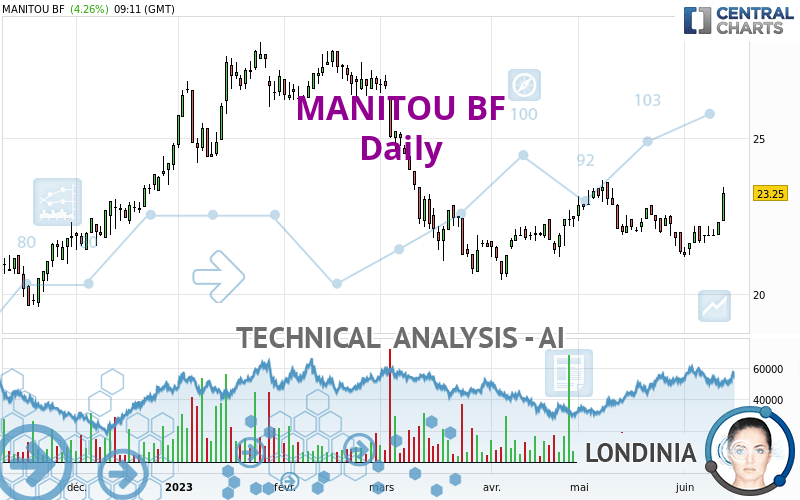
MANITOU BF - Daily - Technical analysis published on 06/13/2023 (GMT)
- 147
- 0
Click here for a new analysis!
- Timeframe : Daily
- - Analysis generated on
- Status : TARGET REACHED

Summary of the analysis

Additional analysis
Quotes
The MANITOU BF price is 23.25 EUR. On the day, this instrument gained +4.26% and was traded between 22.35 EUR and 23.45 EUR over the period. The price is currently at +4.03% from its lowest and -0.85% from its highest.The Central Gaps scanner detects the formation of a bullish gap marking the strong presence of buyers against sellers at the opening. This formed a quotation gap.
Opening Gap UP
Type : Bullish
Timeframe : Openning
Here is a more detailed summary of the historical variations registered by MANITOU BF:
New HIGH record (1 month)
Type : Bullish
Timeframe : Weekly
Technical
Technical analysis of MANITOU BF in Daily shows an overall bullish trend. 64.29% of the signals given by moving averages are bullish. This bullish trend is supported by the strong bullish signals given by short-term moving averages. The Central Indicators market scanner is currently detecting several bullish signals that could impact this trend:
Bullish trend reversal : adaptative moving average 50
Type : Bullish
Timeframe : Daily
Bullish trend reversal : adaptative moving average 100
Type : Bullish
Timeframe : Daily
Bullish price crossover with Moving Average 100
Type : Bullish
Timeframe : Daily
In fact, according to the parameters integrated into the Central Analyzer system, 16 technical indicators out of 18 analysed are currently bullish. But beware of excesses. The Central Indicators scanner currently detects this:
CCI indicator is overbought : over 100
Type : Neutral
Timeframe : Daily
Williams %R indicator is overbought : over -20
Type : Neutral
Timeframe : Daily
Pivot points : price is over resistance 3
Type : Neutral
Timeframe : Daily
Pivot points : price is over resistance 3
Type : Neutral
Timeframe : Weekly
The Central Patterns scanner, which studies chart patterns, resistances and supports, has identified these signals:
Horizontal resistance is broken
Type : Bullish
Timeframe : Daily
Resistance of channel is broken
Type : Bullish
Timeframe : Daily
The presence of a bullish Japanese candlestick pattern detected by Central Candlesticks that could cause a very short term rebound was also detected:
Upside gap
Type : Bullish
Timeframe : Daily
| S3 | S2 | S1 | Price | R1 | R2 | R3 | |
|---|---|---|---|---|---|---|---|
| ProTrendLines | 20.24 | 21.29 | 22.76 | 23.25 | 23.63 | 25.87 | 26.85 |
| Change (%) | -12.95% | -8.43% | -2.11% | - | +1.63% | +11.27% | +15.48% |
| Change | -3.01 | -1.96 | -0.49 | - | +0.38 | +2.62 | +3.60 |
| Level | Intermediate | Major | Minor | - | Major | Minor | Major |
To determine price objectives, it is also possible to use the pivot points. Here is the price position in relation to pivot points:
| Pivot points | S3 | S2 | S1 | PP | R1 | R2 | R3 |
|---|---|---|---|---|---|---|---|
| Standard | 21.63 | 21.77 | 22.03 | 22.17 | 22.43 | 22.57 | 22.83 |
| Camarilla | 22.19 | 22.23 | 22.26 | 22.30 | 22.34 | 22.37 | 22.41 |
| Woodie | 21.70 | 21.80 | 22.10 | 22.20 | 22.50 | 22.60 | 22.90 |
| Fibonacci | 21.77 | 21.92 | 22.01 | 22.17 | 22.32 | 22.41 | 22.57 |
| Pivot points | S3 | S2 | S1 | PP | R1 | R2 | R3 |
|---|---|---|---|---|---|---|---|
| Standard | 21.08 | 21.37 | 21.63 | 21.92 | 22.18 | 22.47 | 22.73 |
| Camarilla | 21.75 | 21.80 | 21.85 | 21.90 | 21.95 | 22.00 | 22.05 |
| Woodie | 21.08 | 21.36 | 21.63 | 21.91 | 22.18 | 22.46 | 22.73 |
| Fibonacci | 21.37 | 21.58 | 21.71 | 21.92 | 22.13 | 22.26 | 22.47 |
| Pivot points | S3 | S2 | S1 | PP | R1 | R2 | R3 |
|---|---|---|---|---|---|---|---|
| Standard | 18.97 | 20.09 | 20.72 | 21.84 | 22.47 | 23.59 | 24.22 |
| Camarilla | 20.87 | 21.03 | 21.19 | 21.35 | 21.51 | 21.67 | 21.83 |
| Woodie | 18.73 | 19.97 | 20.48 | 21.72 | 22.23 | 23.47 | 23.98 |
| Fibonacci | 20.09 | 20.76 | 21.17 | 21.84 | 22.51 | 22.92 | 23.59 |
Numerical data
The following is the status of the technical indicators and moving averages at the time of publication of this technical analysis:
| RSI (14): | 67.48 | |
| MACD (12,26,9): | 0.1600 | |
| Directional Movement: | 26.58 | |
| AROON (14): | 57.14 | |
| DEMA (21): | 22.09 | |
| Parabolic SAR (0,02-0,02-0,2): | 21.34 | |
| Elder Ray (13): | 0.86 | |
| Super Trend (3,10): | 21.42 | |
| Zig ZAG (10): | 23.25 | |
| VORTEX (21): | 1.0800 | |
| Stochastique (14,3,5): | 87.04 | |
| TEMA (21): | 22.31 | |
| Williams %R (14): | -8.89 | |
| Chande Momentum Oscillator (20): | 1.46 | |
| Repulse (5,40,3): | 5.4900 | |
| ROCnROLL: | 1 | |
| TRIX (15,9): | 0.0200 | |
| Courbe Coppock: | 4.31 |
| MA7: | 22.14 | |
| MA20: | 21.80 | |
| MA50: | 21.62 | |
| MA100: | 23.08 | |
| MAexp7: | 22.26 | |
| MAexp20: | 21.94 | |
| MAexp50: | 21.99 | |
| MAexp100: | 22.14 | |
| Price / MA7: | +5.01% | |
| Price / MA20: | +6.65% | |
| Price / MA50: | +7.54% | |
| Price / MA100: | +0.74% | |
| Price / MAexp7: | +4.45% | |
| Price / MAexp20: | +5.97% | |
| Price / MAexp50: | +5.73% | |
| Price / MAexp100: | +5.01% |
News
The latest news and videos published on MANITOU BF at the time of the analysis were as follows:
About author
Online


Add a comment
Comments
0 comments on the analysis MANITOU BF - Daily