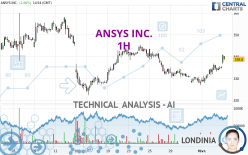
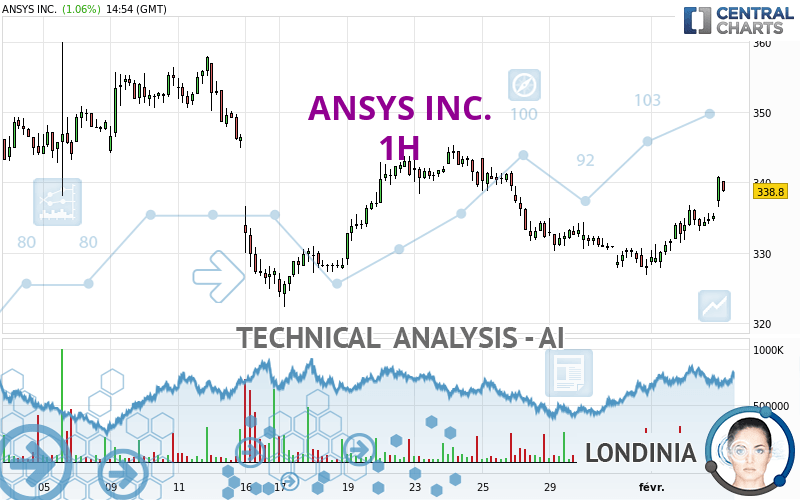
ANSYS INC. - 1H - Technical analysis published on 02/05/2024 (GMT)
- 121
- 0
Click here for a new analysis!
- Timeframe : 1H
- - Analysis generated on
- Status : INVALID
Summary of the analysis

Additional analysis
Quotes
The ANSYS INC. rating is 340.69 USD. The price registered an increase of +1.62% on the session and was traded between 336.54 USD and 340.69 USD over the period. The price is currently at +1.23% from its lowest and 0% from its highest.A bullish gap was detected at the opening by the Central Gaps scanner. There are a lot of buyers and they have the upper hand in the very short term.
Opening Gap UP
Type : Bullish
Timeframe : Openning
Here is a more detailed summary of the historical variations registered by ANSYS INC.:
Near a new LOW record (1st january)
Type : Bearish
Timeframe : Weekly
Near a new LOW record (1 month)
Type : Bearish
Timeframe : Weekly
Abnormal volumes on ANSYS INC. were detected by the Central Volumes scanner:
Abnormal volumes
Timeframe : 20 days
Abnormal volumes
Timeframe : 50 days
Technical
Technical analysis of ANSYS INC. in 1H shows an overall slightly bullish trend. 53.57% of the signals given by moving averages are bullish. The overall trend could accelerate as strong bullish signals from short-term moving averages are expected. An assessment of moving averages reveals a bullish signal that could impact this trend:
Bullish trend reversal : adaptative moving average 100
Type : Bullish
Timeframe : 1 hour
Technical indicators are strongly bullish, suggesting that the price increase should continue.
But beware of excesses. The Central Indicators scanner currently detects this:
CCI indicator is overbought : over 100
Type : Neutral
Timeframe : 1 hour
Williams %R indicator is overbought : over -20
Type : Neutral
Timeframe : 1 hour
Pivot points : price is over resistance 2
Type : Neutral
Timeframe : 1 hour
Ichimoku : price is over the cloud
Type : Bullish
Timeframe : 1 hour
The Central Patterns scanner, which studies chart patterns, resistances and supports, has identified these signals:
Near horizontal resistance
Type : Bearish
Timeframe : 1 hour
Resistance of channel is broken
Type : Bullish
Timeframe : 1 hour
For a small rebound in the very short term, the Central Candlesticks scanner currently notes the presence of this bullish pattern in Japanese candlesticks:
Upside gap
Type : Bullish
Timeframe : 1 hour
| S3 | S2 | S1 | Price | R1 | R2 | R3 | |
|---|---|---|---|---|---|---|---|
| ProTrendLines | 327.65 | 334.29 | 338.10 | 340.69 | 345.28 | 348.98 | 362.88 |
| Change (%) | -3.83% | -1.88% | -0.76% | - | +1.35% | +2.43% | +6.51% |
| Change | -13.04 | -6.40 | -2.59 | - | +4.59 | +8.29 | +22.19 |
| Level | Major | Minor | Intermediate | - | Intermediate | Major | Intermediate |
Attention could also be paid to pivot points to set price objectives:
| Pivot points | S3 | S2 | S1 | PP | R1 | R2 | R3 |
|---|---|---|---|---|---|---|---|
| Standard | 327.45 | 329.63 | 332.44 | 334.62 | 337.43 | 339.61 | 342.42 |
| Camarilla | 333.88 | 334.34 | 334.79 | 335.25 | 335.71 | 336.17 | 336.62 |
| Woodie | 327.77 | 329.79 | 332.76 | 334.78 | 337.75 | 339.77 | 342.74 |
| Fibonacci | 329.63 | 331.54 | 332.71 | 334.62 | 336.53 | 337.70 | 339.61 |
| Pivot points | S3 | S2 | S1 | PP | R1 | R2 | R3 |
|---|---|---|---|---|---|---|---|
| Standard | 319.15 | 322.99 | 329.12 | 332.96 | 339.09 | 342.93 | 349.06 |
| Camarilla | 332.51 | 333.42 | 334.34 | 335.25 | 336.16 | 337.08 | 337.99 |
| Woodie | 320.30 | 323.56 | 330.27 | 333.53 | 340.24 | 343.50 | 350.21 |
| Fibonacci | 322.99 | 326.80 | 329.15 | 332.96 | 336.77 | 339.12 | 342.93 |
| Pivot points | S3 | S2 | S1 | PP | R1 | R2 | R3 |
|---|---|---|---|---|---|---|---|
| Standard | 275.63 | 298.94 | 313.38 | 336.69 | 351.13 | 374.44 | 388.88 |
| Camarilla | 317.45 | 320.91 | 324.37 | 327.83 | 331.29 | 334.75 | 338.21 |
| Woodie | 271.21 | 296.72 | 308.96 | 334.47 | 346.71 | 372.22 | 384.46 |
| Fibonacci | 298.94 | 313.36 | 322.27 | 336.69 | 351.11 | 360.02 | 374.44 |
Numerical data
The following is the status of technical indicators and moving averages registered at the time this technical analysis was created:
| RSI (14): | 69.79 | |
| MACD (12,26,9): | 1.1100 | |
| Directional Movement: | 18.35 | |
| AROON (14): | 85.71 | |
| DEMA (21): | 334.59 | |
| Parabolic SAR (0,02-0,02-0,2): | 333.08 | |
| Elder Ray (13): | 3.79 | |
| Super Trend (3,10): | 331.36 | |
| Zig ZAG (10): | 339.99 | |
| VORTEX (21): | 1.1400 | |
| Stochastique (14,3,5): | 87.11 | |
| TEMA (21): | 336.55 | |
| Williams %R (14): | -1.54 | |
| Chande Momentum Oscillator (20): | 9.57 | |
| Repulse (5,40,3): | 1.1300 | |
| ROCnROLL: | 1 | |
| TRIX (15,9): | 0.0100 | |
| Courbe Coppock: | 3.80 |
| MA7: | 333.21 | |
| MA20: | 338.89 | |
| MA50: | 322.65 | |
| MA100: | 307.83 | |
| MAexp7: | 335.84 | |
| MAexp20: | 333.57 | |
| MAexp50: | 333.91 | |
| MAexp100: | 334.99 | |
| Price / MA7: | +2.24% | |
| Price / MA20: | +0.53% | |
| Price / MA50: | +5.59% | |
| Price / MA100: | +10.67% | |
| Price / MAexp7: | +1.44% | |
| Price / MAexp20: | +2.13% | |
| Price / MAexp50: | +2.03% | |
| Price / MAexp100: | +1.70% |
News
The latest news and videos published on ANSYS INC. at the time of the analysis were as follows:
- Ansys to Release Fourth Quarter and FY 2023 Earnings on February 21, 2024
- Ansys and DXOMARK Partner on Breakthrough Solution to Validate Virtual Camera Systems
- Ansys Announces Deeper Collaboration with Humanetics to Enhance Human Safety
- ANSYS INVESTOR ALERT BY THE FORMER ATTORNEY GENERAL OF LOUISIANA: Kahn Swick & Foti, LLC Investigates Adequacy of Price and Process in Proposed Sale of ANSYS, Inc. - ANSS
- ALERT: Rowley Law PLLC is Investigating Proposed Acquisition of Ansys
About author
Online


Add a comment
Comments
0 comments on the analysis ANSYS INC. - 1H