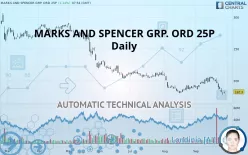
MARKS AND SPENCER GRP. ORD 1P - Daily - Technical analysis published on 09/27/2019 (GMT)
- 460
- 0
- Who voted?
Click here for a new analysis!
- Timeframe : Daily
- - Analysis generated on
- Status : TARGET REACHED

Summary of the analysis

Additional analysis
Quotes
MARKS AND SPENCER GRP. ORD 25P rating 182.30 GBX. On the day, this instrument gained +1.14% with the lowest point at 179.30 GBX and the highest point at 182.90 GBX. The deviation from the price is +1.67% for the low point and -0.33% for the high point.The Central Gaps scanner detects a bullish opening marking the presence of buyers ahead of sellers at the opening but not sufficiently marked to allow the price to register a quotation gap.
Bullish opening
Type : Bullish
Timeframe : Openning
A study of price movements over other periods shows the following variations:
New LOW record (5 years)
Type : Bearish
Timeframe : Weekly
Near a new LOW record (1st january)
Type : Bearish
Timeframe : Weekly
Near a new LOW record (1 month)
Type : Bearish
Timeframe : Weekly
Technical
A technical analysis in Daily of this MARKS AND SPENCER GRP. ORD 25P chart shows a sharp bearish trend. The signals given by moving averages are 92.86% bearish. This strong bearish trend is confirmed by the strong signals currently being given by short-term moving averages. The Central Indicators scanner does not detect any result on moving averages that would impact this trend.
In fact, Central Analyzer took into account 18 technical indicators and the result was as follows: 4 are bullish, 4 are neutral and 10 are bearish. Caution: the Central Indicators scanner currently detects an excess:
CCI indicator is oversold : under -100
Type : Neutral
Timeframe : Daily
Williams %R indicator is oversold : under -80
Type : Neutral
Timeframe : Daily
Pivot points : price is under support 3
Type : Neutral
Timeframe : Weekly
Central Patterns, the market scanner focusing on chart patterns, resistances and supports found these results:
Near support of triangle
Type : Bullish
Timeframe : Daily
Horizontal support is broken
Type : Bearish
Timeframe : Daily
Support of channel is broken
Type : Bearish
Timeframe : Daily
The Central Candlesticks scanner currently notes the presence of this pattern in Japanese candlesticks that could mark the end of the short-term trend currently underway:
Doji
Type : Neutral
Timeframe : Daily
| S1 | Price | R1 | R2 | R3 | |
|---|---|---|---|---|---|
| ProTrendLines | 180.35 | 182.30 | 200.00 | 265.32 | 290.29 |
| Change (%) | -1.07% | - | +9.71% | +45.54% | +59.24% |
| Change | -1.95 | - | +17.70 | +83.02 | +107.99 |
| Level | Minor | - | Major | Minor | Minor |
To determine price objectives, it is also possible to use the pivot points. Here is the price position in relation to pivot points:
| Pivot points | S3 | S2 | S1 | PP | R1 | R2 | R3 |
|---|---|---|---|---|---|---|---|
| Standard | 172.12 | 174.48 | 177.37 | 179.73 | 182.62 | 184.98 | 187.87 |
| Camarilla | 178.81 | 179.29 | 179.77 | 180.25 | 180.73 | 181.21 | 181.69 |
| Woodie | 172.38 | 174.61 | 177.63 | 179.86 | 182.88 | 185.11 | 188.13 |
| Fibonacci | 174.48 | 176.49 | 177.73 | 179.73 | 181.74 | 182.98 | 184.98 |
| Pivot points | S3 | S2 | S1 | PP | R1 | R2 | R3 |
|---|---|---|---|---|---|---|---|
| Standard | 182.32 | 189.08 | 192.47 | 199.23 | 202.62 | 209.38 | 212.77 |
| Camarilla | 193.06 | 193.99 | 194.92 | 195.85 | 196.78 | 197.71 | 198.64 |
| Woodie | 180.63 | 188.24 | 190.78 | 198.39 | 200.93 | 208.54 | 211.08 |
| Fibonacci | 189.08 | 192.96 | 195.36 | 199.23 | 203.11 | 205.51 | 209.38 |
| Pivot points | S3 | S2 | S1 | PP | R1 | R2 | R3 |
|---|---|---|---|---|---|---|---|
| Standard | 145.13 | 162.42 | 177.33 | 194.62 | 209.53 | 226.82 | 241.73 |
| Camarilla | 183.40 | 186.35 | 189.30 | 192.25 | 195.20 | 198.15 | 201.11 |
| Woodie | 143.95 | 161.83 | 176.15 | 194.03 | 208.35 | 226.23 | 240.55 |
| Fibonacci | 162.42 | 174.72 | 182.32 | 194.62 | 206.92 | 214.52 | 226.82 |
Numerical data
The following is the status of the technical indicators and moving averages at the time of publication of this technical analysis:
| RSI (14): | 36.49 | |
| MACD (12,26,9): | -2.7000 | |
| Directional Movement: | -20.37 | |
| AROON (14): | -57.15 | |
| DEMA (21): | 189.31 | |
| Parabolic SAR (0,02-0,02-0,2): | 198.94 | |
| Elder Ray (13): | -9.37 | |
| Super Trend (3,10): | 196.11 | |
| Zig ZAG (10): | 182.15 | |
| VORTEX (21): | 0.8800 | |
| Stochastique (14,3,5): | 10.76 | |
| TEMA (21): | 188.14 | |
| Williams %R (14): | -81.30 | |
| Chande Momentum Oscillator (20): | -20.70 | |
| Repulse (5,40,3): | -1.2100 | |
| ROCnROLL: | 2 | |
| TRIX (15,9): | 0.0000 | |
| Courbe Coppock: | 7.22 |
| MA7: | 187.76 | |
| MA20: | 194.58 | |
| MA50: | 194.73 | |
| MA100: | 209.85 | |
| MAexp7: | 186.79 | |
| MAexp20: | 192.05 | |
| MAexp50: | 197.39 | |
| MAexp100: | 210.54 | |
| Price / MA7: | -2.91% | |
| Price / MA20: | -6.31% | |
| Price / MA50: | -6.38% | |
| Price / MA100: | -13.13% | |
| Price / MAexp7: | -2.40% | |
| Price / MAexp20: | -5.08% | |
| Price / MAexp50: | -7.64% | |
| Price / MAexp100: | -13.41% |
News
The latest news and videos published on MARKS AND SPENCER GRP. ORD 25P at the time of the analysis were as follows:
- CHARG Resource Center receives charitable donation to assist in providing services to those living with mental illness in Denver area
- Spencer Stuart Launches New Unit Formed from the Talent-Related Businesses it Acquired from Aon
- Spencer Stuart Launches New Unit Formed from the Talent-Related Businesses it Acquired from Aon
- Access to Quality Schools Highlights Lifestyle Advantages at Spencer’s Crossing in Murrieta
- Palmetto at Spencer’s Crossing Charms Buyers With Well-Planned Designs and Tempting Options
About author

Online


Add a comment
Comments
0 comments on the analysis MARKS AND SPENCER GRP. ORD 1P - Daily