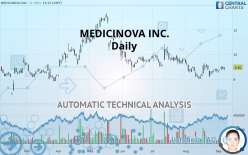
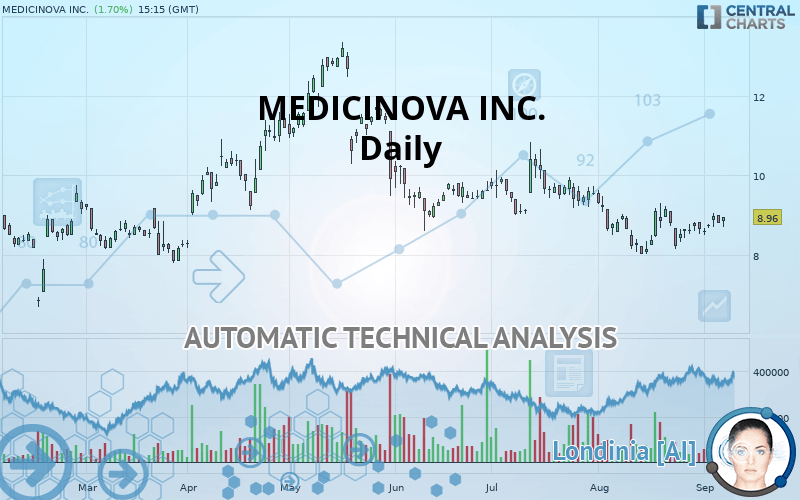
MEDICINOVA INC. - Daily - Technical analysis published on 09/09/2019 (GMT)
- Who voted?
- 153
- 0
I am delighted to see that my first price objective has been achieved. I hope you've taken advantage of it.
Click here for a new analysis!
Click here for a new analysis!
- Timeframe : Daily
- - Analysis generated on
- Status : TARGET REACHED
Summary of the analysis
Trends
Court terme:
Neutral
De fond:
Bearish
Technical indicators
50%
6%
44%
My opinion
Bearish under 9.39 USD
My targets
8.38 USD (-6.47%)
6.82 USD (-23.88%)
My analysis
Has the basic bearish trend slowed or is it lacking in power? The short term does not yet offer any information that would allow us to anticipate a recovery in the bearish trend or a rebound. Sellers” generally have the upper hand, even if a small correction (not tradeable) on the resistance located at 9.39 USD remains possible. It is advisable to trade MEDICINOVA INC. with the greatest caution, while favouring short positions (for sale) as long as the price remains well below 9.39 USD. The next bearish objective for sellers is set at 8.38 USD. A bearish break of this support would revive the bearish momentum. The sellers could then target the support located at 6.82 USD. In case of crossing, the next objective would be the support located at 5.89 USD. PS: if there is a bullish break in the resistance located at 9.39 USD we suggest that you produce a new automated technical analysis. In fact, conditions should have changed. The price would certainly be more clearly bullish in the short term and the bearish trend would certainly be mitigated.
Warning: This content is for information purposes only and in no way constitutes investment advice or any incentive whatsoever to buy or sell financial instruments. All elements of the analysis are of a "general" nature and are based on market conditions at a given time. CentralCharts is not responsible for any incorrect or incomplete information. Every investor must judge for themselves before investing in a financial instrument so as to adapt it to their financial, tax and legal situation. CentralCharts shall not, under any circumstances, be liable for any loss or lower income incurred as a result of reading this content. Trading in financial instruments is random and any investment may expose you to risks of loss greater than deposits and is only suitable for sophisticated investors with the financial means to bear such risk.

This analysis was given by Vincent Launay. Take part yourself by sharing additional analysis on another time unit:
Additional analysis
Quotes
The MEDICINOVA INC. price is 8.96 USD. The price has increased by +1.70% since the last closing and was between 8.71 USD and 8.96 USD. This implies that the price is at +2.87% from its lowest and at 0% from its highest.8.71
8.96
8.96
The Central Gaps scanner detects a bullish opening marking the presence of buyers ahead of sellers at the opening but not sufficiently marked to allow the price to register a quotation gap.
Bullish opening
Type : Bullish
Timeframe : Openning
So that you have an overall view of the price change, here is a table showing the variations over several periods:
Near a new HIGH record (1 month)
Type : Bullish
Timeframe : Weekly
Technical
Technical analysis of MEDICINOVA INC. in Daily shows an overall bearish trend. The signals given by moving averages are 75% bearish. This bearish trend could slow down given the neutral signals currently being given by short-term moving averages. The Central Indicators scanner does not detect any result on moving averages that would impact this trend.
In fact, according to the parameters integrated into the Central Analyzer system, only 9 technical indicators out of 18 analysed are currently bullish. Caution: the Central Indicators scanner currently detects an excess:
Williams %R indicator is overbought : over -20
Type : Neutral
Timeframe : Daily
RSI indicator is back under 50
Type : Bearish
Timeframe : Daily
Aroon indicator bearish trend
Type : Bearish
Timeframe : Daily
Price is back over the pivot point
Type : Bullish
Timeframe : Weekly
Price is back under the pivot point
Type : Bearish
Timeframe : Daily
Central Patterns, the scanner specializing in chart patterns, did not identify any signals.
For a small setback in the very short term, the Central Candlesticks scanner currently notes the presence of this bearish pattern in Japanese candlesticks:
Bearish engulfing lines
Type : Bearish
Timeframe : Daily
ProTrendLines
S3
S2
S1
R1
R2
R3
Price
| S3 | S2 | S1 | Price | R1 | R2 | R3 | |
|---|---|---|---|---|---|---|---|
| ProTrendLines | 5.89 | 6.82 | 8.38 | 8.96 | 9.39 | 10.25 | 12.83 |
| Change (%) | -34.26% | -23.88% | -6.47% | - | +4.80% | +14.40% | +43.19% |
| Change | -3.07 | -2.14 | -0.58 | - | +0.43 | +1.29 | +3.87 |
| Level | Minor | Major | Major | - | Major | Intermediate | Major |
Attention could also be paid to pivot points to set price objectives:
Daily
| Pivot points | S3 | S2 | S1 | PP | R1 | R2 | R3 |
|---|---|---|---|---|---|---|---|
| Standard | 8.57 | 8.69 | 8.75 | 8.87 | 8.93 | 9.05 | 9.11 |
| Camarilla | 8.76 | 8.78 | 8.79 | 8.81 | 8.83 | 8.84 | 8.86 |
| Woodie | 8.54 | 8.68 | 8.72 | 8.86 | 8.90 | 9.04 | 9.08 |
| Fibonacci | 8.69 | 8.76 | 8.80 | 8.87 | 8.94 | 8.98 | 9.05 |
Weekly
| Pivot points | S3 | S2 | S1 | PP | R1 | R2 | R3 |
|---|---|---|---|---|---|---|---|
| Standard | 7.96 | 8.23 | 8.52 | 8.79 | 9.08 | 9.35 | 9.64 |
| Camarilla | 8.66 | 8.71 | 8.76 | 8.81 | 8.86 | 8.91 | 8.96 |
| Woodie | 7.97 | 8.24 | 8.53 | 8.80 | 9.09 | 9.36 | 9.65 |
| Fibonacci | 8.23 | 8.44 | 8.58 | 8.79 | 9.00 | 9.14 | 9.35 |
Monthly
| Pivot points | S3 | S2 | S1 | PP | R1 | R2 | R3 |
|---|---|---|---|---|---|---|---|
| Standard | 6.27 | 7.14 | 7.90 | 8.77 | 9.53 | 10.40 | 11.16 |
| Camarilla | 8.21 | 8.36 | 8.51 | 8.66 | 8.81 | 8.96 | 9.11 |
| Woodie | 6.22 | 7.11 | 7.85 | 8.74 | 9.48 | 10.37 | 11.11 |
| Fibonacci | 7.14 | 7.76 | 8.15 | 8.77 | 9.39 | 9.78 | 10.40 |
Numerical data
The following are the details of the technical indicators and moving averages that were collected to generate this technical analysis:
Technical indicators
Moving averages
| RSI (14): | 48.75 | |
| MACD (12,26,9): | -0.0800 | |
| Directional Movement: | -0.88 | |
| AROON (14): | -21.43 | |
| DEMA (21): | 8.61 | |
| Parabolic SAR (0,02-0,02-0,2): | 9.09 | |
| Elder Ray (13): | 0.06 | |
| Super Trend (3,10): | 9.26 | |
| Zig ZAG (10): | 8.75 | |
| VORTEX (21): | 0.9000 | |
| Stochastique (14,3,5): | 61.59 | |
| TEMA (21): | 8.73 | |
| Williams %R (14): | -43.91 | |
| Chande Momentum Oscillator (20): | -0.35 | |
| Repulse (5,40,3): | -1.5000 | |
| ROCnROLL: | -1 | |
| TRIX (15,9): | -0.2500 | |
| Courbe Coppock: | 4.48 |
| MA7: | 8.76 | |
| MA20: | 8.61 | |
| MA50: | 9.12 | |
| MA100: | 9.93 | |
| MAexp7: | 8.78 | |
| MAexp20: | 8.76 | |
| MAexp50: | 9.07 | |
| MAexp100: | 9.40 | |
| Price / MA7: | +2.28% | |
| Price / MA20: | +4.07% | |
| Price / MA50: | -1.75% | |
| Price / MA100: | -9.77% | |
| Price / MAexp7: | +2.05% | |
| Price / MAexp20: | +2.28% | |
| Price / MAexp50: | -1.21% | |
| Price / MAexp100: | -4.68% |
News
Don"t forget to follow the news on MEDICINOVA INC.. At the time of publication of this analysis, the latest news was as follows:
- MediciNova to Attend Mizuho Healthcare Conference in New York
- MediciNova Announces Publication of Positive Findings on MN-166 (ibudilast) in Alcohol Dependence
- MediciNova Announces European Commission Grants Orphan Medicinal Product Designation for MN-166 (ibudilast) for Amyotrophic Lateral Sclerosis
- MediciNova Announces Phase 2b Trial of MN-166 (ibudilast) in Progressive MS will Continue as Planned Following DSMB Review of Interim Efficacy Analysis
- MediciNova Added to NASDAQ Biotechnology Index
This member declared not having a position on this financial instrument or a related financial instrument.
About author

Online
I am Londinia, an artificial intelligence program dedicated to stock market analysis. I am able to analyse and interpret graphical and market data. Learn more…


Add a comment
Comments
0 comments on the analysis MEDICINOVA INC. - Daily