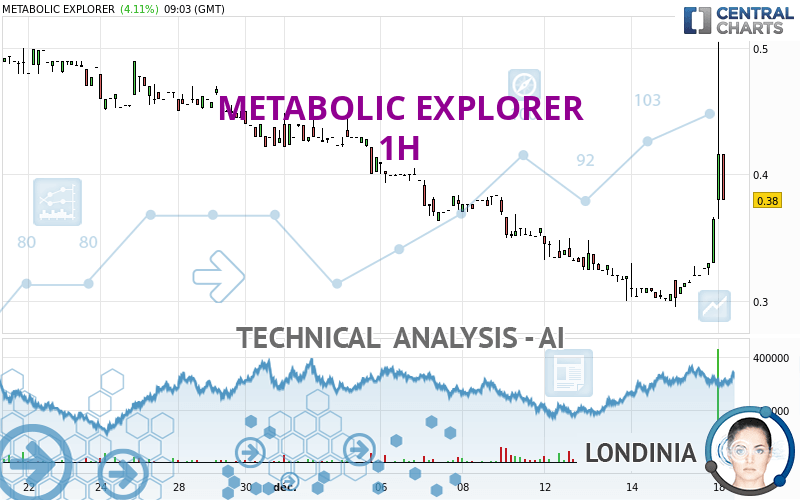
METABOLIC EXPLORER - 1H - Technical analysis published on 12/18/2023 (GMT)
- 104
- 0
Click here for a new analysis!
- Timeframe : 1H
- - Analysis generated on
- Status : INVALID
Summary of the analysis

Additional analysis
Quotes
METABOLIC EXPLORER rating 0.4100 EUR. On the day, this instrument gained +12.33% with the lowest point at 0.3650 EUR and the highest point at 0.5050 EUR. The deviation from the price is +12.33% for the low point and -18.81% for the high point.The Central Gaps scanner detects a bullish gap which is a sign that buyers have taken the lead in the very short term.
Opening Gap UP
Type : Bullish
Timeframe : Openning
Here is a more detailed summary of the historical variations registered by METABOLIC EXPLORER:
Near a new HIGH record (1 month)
Type : Bullish
Timeframe : Weekly
The Central Volumes scanner detects abnormal volumes on the asset:
Abnormal volumes
Timeframe : 5 days
Abnormal volumes
Timeframe : 50 days
Technical
Technical analysis of METABOLIC EXPLORER in 1H shows an overall slightly bullish trend. 60.71% of the signals given by moving averages are bullish. The overall trend could accelerate as strong bullish signals from short-term moving averages are expected. An assessment of moving averages reveals several bullish signals that could impact this trend:
Bullish trend reversal : adaptative moving average 50
Type : Bullish
Timeframe : 1 hour
Bullish price crossover with Moving Average 100
Type : Bullish
Timeframe : 1 hour
In fact, according to the parameters integrated into the Central Analyzer system, 16 technical indicators out of 18 analysed are currently bullish. But beware of excesses. The Central Indicators scanner currently detects this:
RSI indicator is overbought : over 80
Type : Neutral
Timeframe : 1 hour
CCI indicator is overbought : over 100
Type : Neutral
Timeframe : 1 hour
Pivot points : price is over resistance 2
Type : Neutral
Timeframe : 1 hour
Pivot points : price is over resistance 2
Type : Neutral
Timeframe : Weekly
Ichimoku : price is over the cloud
Type : Bullish
Timeframe : 1 hour
An analysis of the price chart with the Central Patterns scanner (detector of chart patterns and resistances and supports) shows a result that can have an impact on the price change:
Resistance of channel is broken
Type : Bullish
Timeframe : 1 hour
For a small rebound in the very short term, the Central Candlesticks scanner currently notes the presence of this bullish pattern in Japanese candlesticks:
Long white line
Type : Bullish
Timeframe : 1 hour
| S3 | S2 | S1 | Price | R1 | R2 | R3 | |
|---|---|---|---|---|---|---|---|
| ProTrendLines | 0.2950 | 0.3160 | 0.3840 | 0.4100 | 0.4610 | 0.5750 | 0.7493 |
| Change (%) | -28.05% | -22.93% | -6.34% | - | +12.44% | +40.24% | +82.76% |
| Change | -0.1150 | -0.0940 | -0.0260 | - | +0.0510 | +0.1650 | +0.3393 |
| Level | Minor | Intermediate | Minor | - | Major | Minor | Minor |
To determine price objectives, it is also possible to use the pivot points. Here is the price position in relation to pivot points:
| Pivot points | S3 | S2 | S1 | PP | R1 | R2 | R3 |
|---|---|---|---|---|---|---|---|
| Standard | 0.2470 | 0.2710 | 0.3180 | 0.3420 | 0.3890 | 0.4130 | 0.4600 |
| Camarilla | 0.3455 | 0.3520 | 0.3585 | 0.3650 | 0.3715 | 0.3780 | 0.3845 |
| Woodie | 0.2585 | 0.2768 | 0.3295 | 0.3478 | 0.4005 | 0.4188 | 0.4715 |
| Fibonacci | 0.2710 | 0.2981 | 0.3149 | 0.3420 | 0.3691 | 0.3859 | 0.4130 |
| Pivot points | S3 | S2 | S1 | PP | R1 | R2 | R3 |
|---|---|---|---|---|---|---|---|
| Standard | 0.2257 | 0.2603 | 0.3127 | 0.3473 | 0.3997 | 0.4343 | 0.4867 |
| Camarilla | 0.3411 | 0.3491 | 0.3570 | 0.3650 | 0.3730 | 0.3810 | 0.3889 |
| Woodie | 0.2345 | 0.2648 | 0.3215 | 0.3518 | 0.4085 | 0.4388 | 0.4955 |
| Fibonacci | 0.2603 | 0.2936 | 0.3141 | 0.3473 | 0.3806 | 0.4011 | 0.4343 |
| Pivot points | S3 | S2 | S1 | PP | R1 | R2 | R3 |
|---|---|---|---|---|---|---|---|
| Standard | -0.3277 | 0.0437 | 0.2363 | 0.6077 | 0.8003 | 1.1717 | 1.3643 |
| Camarilla | 0.2739 | 0.3256 | 0.3773 | 0.4290 | 0.4807 | 0.5324 | 0.5841 |
| Woodie | -0.4170 | -0.0010 | 0.1470 | 0.5630 | 0.7110 | 1.1270 | 1.2750 |
| Fibonacci | 0.0437 | 0.2591 | 0.3922 | 0.6077 | 0.8231 | 0.9562 | 1.1717 |
Numerical data
The following is the status of the technical indicators and moving averages at the time of publication of this technical analysis:
| RSI (14): | 87.23 | |
| MACD (12,26,9): | 0.0102 | |
| Directional Movement: | 69.7004 | |
| AROON (14): | 64.2857 | |
| DEMA (21): | 0.3393 | |
| Parabolic SAR (0,02-0,02-0,2): | 0.3023 | |
| Elder Ray (13): | 0.0943 | |
| Super Trend (3,10): | 0.3648 | |
| Zig ZAG (10): | 0.4300 | |
| VORTEX (21): | 1.0921 | |
| Stochastique (14,3,5): | 87.63 | |
| TEMA (21): | 0.3574 | |
| Williams %R (14): | -40.48 | |
| Chande Momentum Oscillator (20): | 0.1240 | |
| Repulse (5,40,3): | 15.1164 | |
| ROCnROLL: | 1 | |
| TRIX (15,9): | -0.1533 | |
| Courbe Coppock: | 23.40 |
| MA7: | 0.3532 | |
| MA20: | 0.4144 | |
| MA50: | 0.3993 | |
| MA100: | 0.5490 | |
| MAexp7: | 0.3685 | |
| MAexp20: | 0.3337 | |
| MAexp50: | 0.3408 | |
| MAexp100: | 0.3694 | |
| Price / MA7: | +16.08% | |
| Price / MA20: | -1.06% | |
| Price / MA50: | +2.68% | |
| Price / MA100: | -25.32% | |
| Price / MAexp7: | +11.26% | |
| Price / MAexp20: | +22.86% | |
| Price / MAexp50: | +20.31% | |
| Price / MAexp100: | +10.99% |
News
The last news published on METABOLIC EXPLORER at the time of the generation of this analysis was as follows:
- Completion of financing operations for the 2023-2024 strategic plan
- METabolic EXplorer announces the second process resulting from its ALTANØØVTM platform for the production of L-Valine.
- METEX provides an update on the situation at its Amiens plant.
- METEX : Signature of the Share Purchase Agreement (SPA) for the transfer of 100% of the capital of Ajinomoto Animal Nutrition Europe (AANE).
- Metabolic Explorer : Construction of the METEX NØØVISTA PDO/BA industrial production unit on the CHEMESIS site in Moselle.
About author
Online


Add a comment
Comments
0 comments on the analysis METABOLIC EXPLORER - 1H