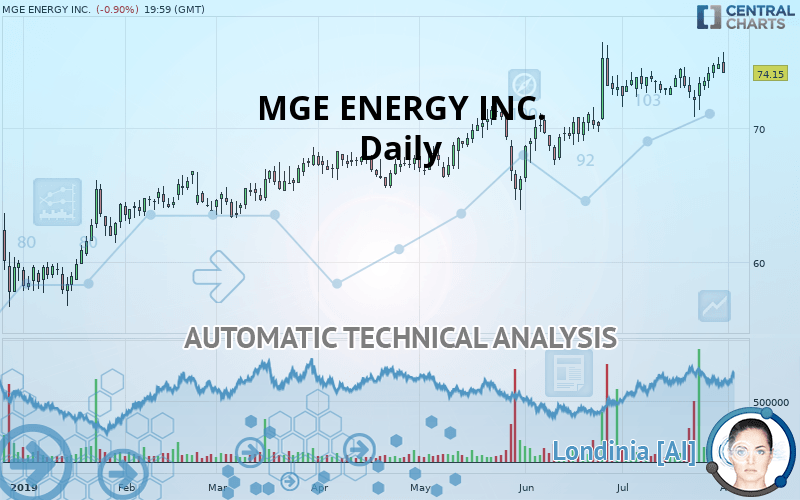
MGE ENERGY INC. - Daily - Technical analysis published on 08/01/2019 (GMT)
- Who voted?
- 237
- 0
Click here for a new analysis!
- Timeframe : Daily
- - Analysis generated on
- Status : TARGET REACHED
Summary of the analysis

Additional analysis
Quotes
MGE ENERGY INC. rating 74.15 USD. The price is lower by -0.90% since the last closing and was traded between 74.10 USD and 75.69 USD over the period. The price is currently at +0.07% from its lowest and -2.03% from its highest.The Central Gaps scanner detects a bullish opening. A small advantage for buyers in the very short term.
Bullish opening
Type : Bullish
Timeframe : Openning
So that you have an overall view of the price change, here is a table showing the variations over several periods:
Near a new HIGH record (5 years)
Type : Bullish
Timeframe : Weekly
Near a new HIGH record (1 year)
Type : Bullish
Timeframe : Weekly
Near a new HIGH record (1st january)
Type : Bullish
Timeframe : Weekly
Near a new LOW record (1 month)
Type : Bearish
Timeframe : Weekly
The Central Volumes scanner detects abnormal volumes on the asset:
Abnormal volumes
Timeframe : 50 days
Technical
A technical analysis in Daily of this MGE ENERGY INC. chart shows a strongly bullish trend. 92.86% of the signals given by moving averages are bullish. The overall trend is supported by the strong bullish signals from short-term moving averages. The Central Indicators scanner does not detect any result on moving averages that would impact this trend.
The probability of a further increase are moderate given the direction of the technical indicators.
Caution: the Central Indicators scanner currently detects an excess:
CCI indicator is overbought : over 100
Type : Neutral
Timeframe : Daily
Williams %R indicator is overbought : over -20
Type : Neutral
Timeframe : Daily
Pivot points : price is under support 1
Type : Neutral
Timeframe : Daily
MACD crosses UP its Moving Average
Type : Bullish
Timeframe : Daily
An analysis of the price chart with the Central Patterns scanner (detector of chart patterns and resistances and supports) shows a result that can have an impact on the price change:
Resistance of channel is broken
Type : Bullish
Timeframe : Daily
The presence of a bullish Japanese candlestick pattern detected by Central Candlesticks that could cause a very short term rebound was also detected:
Three white soldiers
Type : Bullish
Timeframe : Daily
| S3 | S2 | S1 | Price | R1 | |
|---|---|---|---|---|---|
| ProTrendLines | 65.45 | 68.39 | 72.10 | 74.15 | 75.26 |
| Change (%) | -11.73% | -7.77% | -2.76% | - | +1.50% |
| Change | -8.70 | -5.76 | -2.05 | - | +1.11 |
| Level | Major | Major | Major | - | Major |
Attention could also be paid to pivot points to set price objectives:
| Pivot points | S3 | S2 | S1 | PP | R1 | R2 | R3 |
|---|---|---|---|---|---|---|---|
| Standard | 73.46 | 73.93 | 74.38 | 74.85 | 75.30 | 75.77 | 76.22 |
| Camarilla | 74.57 | 74.65 | 74.74 | 74.82 | 74.90 | 74.99 | 75.07 |
| Woodie | 73.44 | 73.93 | 74.36 | 74.85 | 75.28 | 75.77 | 76.20 |
| Fibonacci | 73.93 | 74.29 | 74.50 | 74.85 | 75.21 | 75.42 | 75.77 |
| Pivot points | S3 | S2 | S1 | PP | R1 | R2 | R3 |
|---|---|---|---|---|---|---|---|
| Standard | 68.06 | 69.44 | 71.80 | 73.17 | 75.53 | 76.91 | 79.27 |
| Camarilla | 73.13 | 73.48 | 73.82 | 74.16 | 74.50 | 74.85 | 75.19 |
| Woodie | 68.56 | 69.68 | 72.29 | 73.42 | 76.03 | 77.15 | 79.76 |
| Fibonacci | 69.44 | 70.86 | 71.75 | 73.17 | 74.60 | 75.48 | 76.91 |
| Pivot points | S3 | S2 | S1 | PP | R1 | R2 | R3 |
|---|---|---|---|---|---|---|---|
| Standard | 56.73 | 61.35 | 67.21 | 71.83 | 77.69 | 82.31 | 88.17 |
| Camarilla | 70.20 | 71.16 | 72.12 | 73.08 | 74.04 | 75.00 | 75.96 |
| Woodie | 57.36 | 61.66 | 67.84 | 72.14 | 78.32 | 82.62 | 88.80 |
| Fibonacci | 61.35 | 65.35 | 67.82 | 71.83 | 75.83 | 78.30 | 82.31 |
Numerical data
The following is the status of the technical indicators and moving averages at the time of publication of this technical analysis:
| RSI (14): | 56.99 | |
| MACD (12,26,9): | 0.7200 | |
| Directional Movement: | 11.56 | |
| AROON (14): | 42.86 | |
| DEMA (21): | 74.38 | |
| Parabolic SAR (0,02-0,02-0,2): | 71.07 | |
| Elder Ray (13): | 1.17 | |
| Super Trend (3,10): | 70.70 | |
| Zig ZAG (10): | 74.15 | |
| VORTEX (21): | 1.0800 | |
| Stochastique (14,3,5): | 84.56 | |
| TEMA (21): | 74.29 | |
| Williams %R (14): | -31.56 | |
| Chande Momentum Oscillator (20): | 1.28 | |
| Repulse (5,40,3): | -0.5800 | |
| ROCnROLL: | 1 | |
| TRIX (15,9): | 0.1500 | |
| Courbe Coppock: | 1.55 |
| MA7: | 73.83 | |
| MA20: | 73.56 | |
| MA50: | 71.55 | |
| MA100: | 69.40 | |
| MAexp7: | 74.05 | |
| MAexp20: | 73.38 | |
| MAexp50: | 71.83 | |
| MAexp100: | 69.88 | |
| Price / MA7: | +0.43% | |
| Price / MA20: | +0.80% | |
| Price / MA50: | +3.63% | |
| Price / MA100: | +6.84% | |
| Price / MAexp7: | +0.14% | |
| Price / MAexp20: | +1.05% | |
| Price / MAexp50: | +3.23% | |
| Price / MAexp100: | +6.11% |
News
The latest news and videos published on MGE ENERGY INC. at the time of the analysis were as follows:
 MGE Energy
About author

Online


Add a comment
Comments
0 comments on the analysis MGE ENERGY INC. - Daily