MGIC INVESTMENT - Daily - Technical analysis published on 11/21/2019 (GMT)
- Who voted?
- 204
- 0
Click here for a new analysis!
- Timeframe : Daily
- - Analysis generated on
- Status : TARGET REACHED
Summary of the analysis

Additional analysis
Quotes
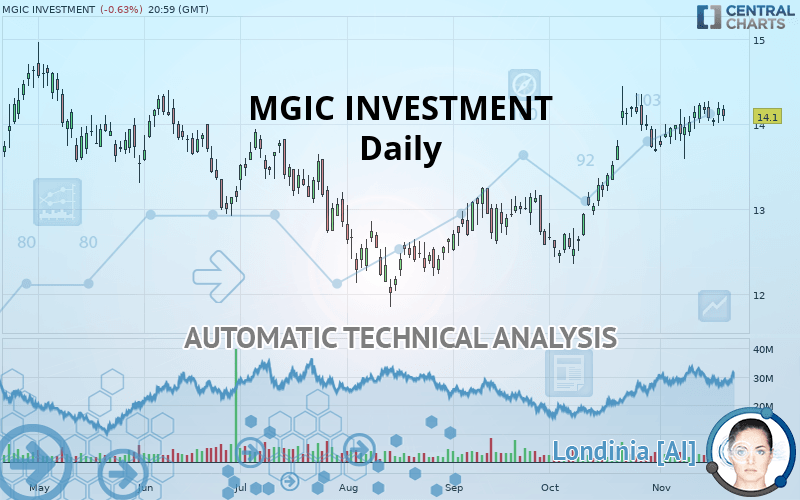
The MGIC INVESTMENT rating is 14.10 USD. On the day, this instrument lost -0.63% and was traded between 14.04 USD and 14.23 USD over the period. The price is currently at +0.43% from its lowest and -0.91% from its highest.A bearish opening was detected by the Central Gaps scanner. Sellers are trying to impose a bearish trend in the very short term.
Bearish opening
Type : Bearish
Timeframe : Openning
So that you have an overall view of the price change, here is a table showing the variations over several periods:
Near a new HIGH record (1 year)
Type : Bullish
Timeframe : Weekly
Near a new HIGH record (1st january)
Type : Bullish
Timeframe : Weekly
Near a new HIGH record (1 month)
Type : Bullish
Timeframe : Weekly
Technical
Technical analysis of MGIC INVESTMENT in Daily shows a strongly overall bullish trend. 92.86% of the signals given by moving averages are bullish. This strongly bullish trend is supported by the strong bullish signals given by short-term moving averages. There is no crossing of moving average by the price or crossing of moving averages between themselves.
In fact, Central Analyzer took into account 18 technical indicators and the result was as follows: 9 are bullish, 5 are neutral and 4 are bearish. Caution: the Central Indicators scanner currently detects an excess:
MACD indicator: bullish divergence
Type : Bullish
Timeframe : Daily
Williams %R indicator is overbought : over -20
Type : Neutral
Timeframe : Daily
Price is back over the pivot point
Type : Bullish
Timeframe : Daily
Price is back over the pivot point
Type : Bullish
Timeframe : Weekly
Central Patterns, the market scanner focusing on chart patterns, resistances and supports found these results:
Near resistance of channel
Type : Bearish
Timeframe : Daily
Horizontal resistance is broken
Type : Bullish
Timeframe : Daily
For a small rebound in the very short term, the Central Candlesticks scanner currently notes the presence of this bullish pattern in Japanese candlesticks:
White morning star
Type : Bullish
Timeframe : Daily
| S3 | S2 | S1 | Price | R1 | R2 | R3 | |
|---|---|---|---|---|---|---|---|
| ProTrendLines | 12.49 | 13.14 | 13.57 | 14.10 | 14.21 | 14.65 | 15.81 |
| Change (%) | -11.42% | -6.81% | -3.76% | - | +0.78% | +3.90% | +12.13% |
| Change | -1.61 | -0.96 | -0.53 | - | +0.11 | +0.55 | +1.71 |
| Level | Minor | Intermediate | Major | - | Major | Major | Intermediate |
To determine price objectives, it is also possible to use the pivot points. Here is the price position in relation to pivot points:
| Pivot points | S3 | S2 | S1 | PP | R1 | R2 | R3 |
|---|---|---|---|---|---|---|---|
| Standard | 13.81 | 13.91 | 14.05 | 14.16 | 14.30 | 14.40 | 14.54 |
| Camarilla | 14.12 | 14.15 | 14.17 | 14.19 | 14.21 | 14.24 | 14.26 |
| Woodie | 13.82 | 13.92 | 14.07 | 14.16 | 14.31 | 14.41 | 14.56 |
| Fibonacci | 13.91 | 14.00 | 14.06 | 14.16 | 14.25 | 14.31 | 14.40 |
| Pivot points | S3 | S2 | S1 | PP | R1 | R2 | R3 |
|---|---|---|---|---|---|---|---|
| Standard | 13.46 | 13.66 | 13.87 | 14.07 | 14.28 | 14.48 | 14.69 |
| Camarilla | 13.97 | 14.01 | 14.04 | 14.08 | 14.12 | 14.16 | 14.19 |
| Woodie | 13.47 | 13.66 | 13.88 | 14.07 | 14.29 | 14.48 | 14.70 |
| Fibonacci | 13.66 | 13.82 | 13.91 | 14.07 | 14.23 | 14.32 | 14.48 |
| Pivot points | S3 | S2 | S1 | PP | R1 | R2 | R3 |
|---|---|---|---|---|---|---|---|
| Standard | 10.43 | 11.37 | 12.51 | 13.45 | 14.59 | 15.53 | 16.67 |
| Camarilla | 13.08 | 13.27 | 13.46 | 13.65 | 13.84 | 14.03 | 14.22 |
| Woodie | 10.53 | 11.42 | 12.61 | 13.50 | 14.69 | 15.58 | 16.77 |
| Fibonacci | 11.37 | 12.16 | 12.65 | 13.45 | 14.24 | 14.74 | 15.53 |
Numerical data
The following is the status of the technical indicators and moving averages at the time of publication of this technical analysis:
| RSI (14): | 61.28 | |
| MACD (12,26,9): | 0.2200 | |
| Directional Movement: | 11.19 | |
| AROON (14): | 35.71 | |
| DEMA (21): | 14.23 | |
| Parabolic SAR (0,02-0,02-0,2): | 13.80 | |
| Elder Ray (13): | 0.11 | |
| Super Trend (3,10): | 13.43 | |
| Zig ZAG (10): | 14.10 | |
| VORTEX (21): | 1.0000 | |
| Stochastique (14,3,5): | 76.96 | |
| TEMA (21): | 14.23 | |
| Williams %R (14): | -25.00 | |
| Chande Momentum Oscillator (20): | 0.27 | |
| Repulse (5,40,3): | -0.0500 | |
| ROCnROLL: | 1 | |
| TRIX (15,9): | 0.2700 | |
| Courbe Coppock: | 3.84 |
| MA7: | 14.14 | |
| MA20: | 13.98 | |
| MA50: | 13.37 | |
| MA100: | 13.08 | |
| MAexp7: | 14.10 | |
| MAexp20: | 13.92 | |
| MAexp50: | 13.54 | |
| MAexp100: | 13.30 | |
| Price / MA7: | -0.28% | |
| Price / MA20: | +0.86% | |
| Price / MA50: | +5.46% | |
| Price / MA100: | +7.80% | |
| Price / MAexp7: | -0% | |
| Price / MAexp20: | +1.29% | |
| Price / MAexp50: | +4.14% | |
| Price / MAexp100: | +6.02% |
News
Don"t forget to follow the news on MGIC INVESTMENT. At the time of publication of this analysis, the latest news was as follows:
- MGIC Investment Corporation Releases Monthly Operating Statistics
- MGIC Names New Executive Vice President - Chief Risk Officer
- Hartzell and Sculley Join MGIC Investment Board
- MGIC Investment Announces Quarterly Dividend of $0.06 Per Share
- MGIC Investment Corporation Reports Third Quarter 2019 Results
About author

Online


Add a comment
Comments
0 comments on the analysis MGIC INVESTMENT - Daily