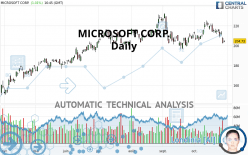
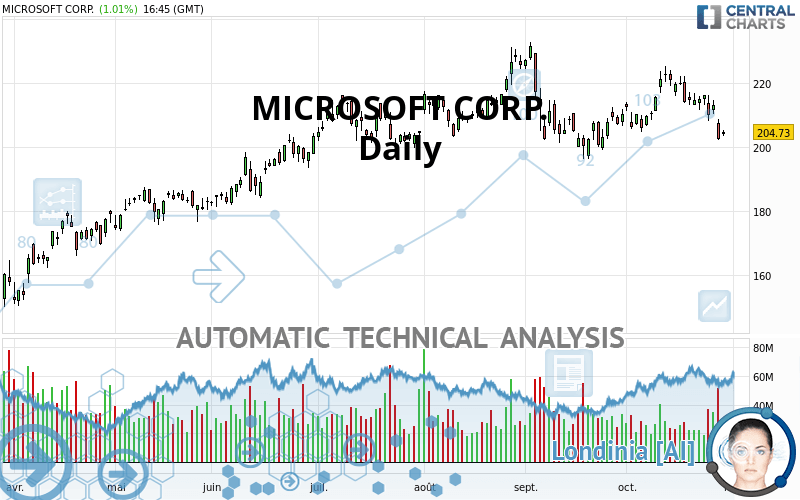
MICROSOFT CORP. - Daily - Technical analysis published on 10/29/2020 (GMT)
- 308
- 0
Click here for a new analysis!
- Timeframe : Daily
- - Analysis generated on
- Status : TARGET REACHED
Summary of the analysis

Additional analysis
Quotes
MICROSOFT CORP. rating 204.78 USD. The price registered an increase of +1.04% on the session and was between 203.37 USD and 205.47 USD. This implies that the price is at +0.69% from its lowest and at -0.34% from its highest.The Central Gaps scanner detects a bullish opening. A small advantage for buyers in the very short term.
Bullish opening
Type : Bullish
Timeframe : Openning
A study of price movements over other periods shows the following variations:
Near a new LOW record (1 month)
Type : Bearish
Timeframe : Weekly
Technical
A technical analysis in Daily of this MICROSOFT CORP. chart shows a slightly bearish trend. 60.71% of the signals given by moving averages are bearish. The overall trend could accelerate as a result of the strong bearish signals from short-term moving averages. The Central Indicators market scanner is currently detecting several bearish signals that could impact this trend:
Bearish trend reversal : Moving Average 20
Type : Bearish
Timeframe : Daily
Bearish trend reversal : Moving Average 50
Type : Bearish
Timeframe : Daily
Bearish trend reversal : adaptative moving average 100
Type : Bearish
Timeframe : Daily
Bearish price crossover with Moving Average 50
Type : Bearish
Timeframe : Daily
Bearish price crossover with Moving Average 100
Type : Bearish
Timeframe : Daily
Bearish price crossover with adaptative moving average 20
Type : Bearish
Timeframe : Daily
Bearish price crossover with adaptative moving average 50
Type : Bearish
Timeframe : Daily
Bearish price crossover with adaptative moving average 100
Type : Bearish
Timeframe : Daily
The probability of a further decline is high given the direction of the technical indicators.
But beware of excesses. The Central Indicators scanner currently detects this:
CCI indicator is oversold : under -100
Type : Neutral
Timeframe : Daily
Williams %R indicator is oversold : under -80
Type : Neutral
Timeframe : Daily
Pivot points : price is under support 3
Type : Neutral
Timeframe : Weekly
Aroon indicator bearish trend
Type : Bearish
Timeframe : Daily
Ichimoku : price is under the cloud
Type : Bearish
Timeframe : Daily
SuperTrend indicator bearish reversal
Type : Bearish
Timeframe : Daily
Ichimoku - Bearish crossover : Tenkan & Kijun
Type : Bearish
Timeframe : Daily
Price is back under the pivot point
Type : Bearish
Timeframe : Daily
An analysis of the price chart with the Central Patterns scanner (detector of chart patterns and resistances and supports) shows several results that can have an impact on the price change:
Near horizontal support
Type : Bullish
Timeframe : Daily
Support of channel is broken
Type : Bearish
Timeframe : Daily
Support of triangle is broken
Type : Bearish
Timeframe : Daily
The Central Candlesticks scanner, specialised in Japanese candlesticks, did not identify any signals.
| S3 | S2 | S1 | Price | R1 | R2 | R3 | |
|---|---|---|---|---|---|---|---|
| ProTrendLines | 167.46 | 188.70 | 200.79 | 204.78 | 214.32 | 222.86 | 231.65 |
| Change (%) | -18.22% | -7.85% | -1.95% | - | +4.66% | +8.83% | +13.12% |
| Change | -37.32 | -16.08 | -3.99 | - | +9.54 | +18.08 | +26.87 |
| Level | Minor | Major | Major | - | Major | Minor | Major |
Attention could also be paid to pivot points to set price objectives:
| Pivot points | S3 | S2 | S1 | PP | R1 | R2 | R3 |
|---|---|---|---|---|---|---|---|
| Standard | 193.50 | 197.80 | 200.24 | 204.54 | 206.98 | 211.28 | 213.72 |
| Camarilla | 200.83 | 201.44 | 202.06 | 202.68 | 203.30 | 203.92 | 204.53 |
| Woodie | 192.57 | 197.34 | 199.31 | 204.08 | 206.05 | 210.82 | 212.79 |
| Fibonacci | 197.80 | 200.38 | 201.97 | 204.54 | 207.12 | 208.71 | 211.28 |
| Pivot points | S3 | S2 | S1 | PP | R1 | R2 | R3 |
|---|---|---|---|---|---|---|---|
| Standard | 200.59 | 206.14 | 211.19 | 216.74 | 221.79 | 227.34 | 232.39 |
| Camarilla | 213.32 | 214.29 | 215.26 | 216.23 | 217.20 | 218.17 | 219.15 |
| Woodie | 200.33 | 206.02 | 210.93 | 216.62 | 221.53 | 227.22 | 232.13 |
| Fibonacci | 206.14 | 210.19 | 212.69 | 216.74 | 220.79 | 223.29 | 227.34 |
| Pivot points | S3 | S2 | S1 | PP | R1 | R2 | R3 |
|---|---|---|---|---|---|---|---|
| Standard | 156.82 | 176.54 | 193.43 | 213.15 | 230.04 | 249.76 | 266.65 |
| Camarilla | 200.26 | 203.62 | 206.97 | 210.33 | 213.69 | 217.04 | 220.40 |
| Woodie | 155.42 | 175.83 | 192.03 | 212.44 | 228.64 | 249.05 | 265.25 |
| Fibonacci | 176.54 | 190.52 | 199.16 | 213.15 | 227.13 | 235.77 | 249.76 |
Numerical data
The following is the status of technical indicators and moving averages registered at the time this technical analysis was created:
| RSI (14): | 41.65 | |
| MACD (12,26,9): | -0.6100 | |
| Directional Movement: | -16.64 | |
| AROON (14): | -78.57 | |
| DEMA (21): | 211.85 | |
| Parabolic SAR (0,02-0,02-0,2): | 222.10 | |
| Elder Ray (13): | -7.14 | |
| Super Trend (3,10): | 220.96 | |
| Zig ZAG (10): | 204.38 | |
| VORTEX (21): | 0.9000 | |
| Stochastique (14,3,5): | 14.22 | |
| TEMA (21): | 210.47 | |
| Williams %R (14): | -89.57 | |
| Chande Momentum Oscillator (20): | -18.36 | |
| Repulse (5,40,3): | -2.1700 | |
| ROCnROLL: | 2 | |
| TRIX (15,9): | 0.0700 | |
| Courbe Coppock: | 2.54 |
| MA7: | 210.94 | |
| MA20: | 213.43 | |
| MA50: | 212.52 | |
| MA100: | 208.61 | |
| MAexp7: | 209.62 | |
| MAexp20: | 212.01 | |
| MAexp50: | 210.92 | |
| MAexp100: | 205.24 | |
| Price / MA7: | -2.92% | |
| Price / MA20: | -4.05% | |
| Price / MA50: | -3.64% | |
| Price / MA100: | -1.84% | |
| Price / MAexp7: | -2.31% | |
| Price / MAexp20: | -3.41% | |
| Price / MAexp50: | -2.91% | |
| Price / MAexp100: | -0.22% |
News
The last news published on MICROSOFT CORP. at the time of the generation of this analysis was as follows:
- NICE First to Achieve Microsoft Teams Certification for Unified Communications Recording, Enabling Digital Transformation of Financial Services Organizations
-
 Sensyne Health and Microsoft strengthen strategic relationship
- Microsoft earnings press release available on Investor Relations website
- Qualys Extends Integration with Microsoft Azure Defender to On-Premises and Multi-Cloud with Microsoft Azure Arc
- Thinking about buying stock in Nio, Microsoft, BP, General Electric, or Remark Holdings?
About author

Online


Add a comment
Comments
0 comments on the analysis MICROSOFT CORP. - Daily