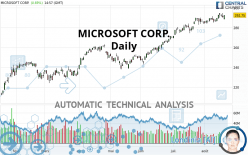
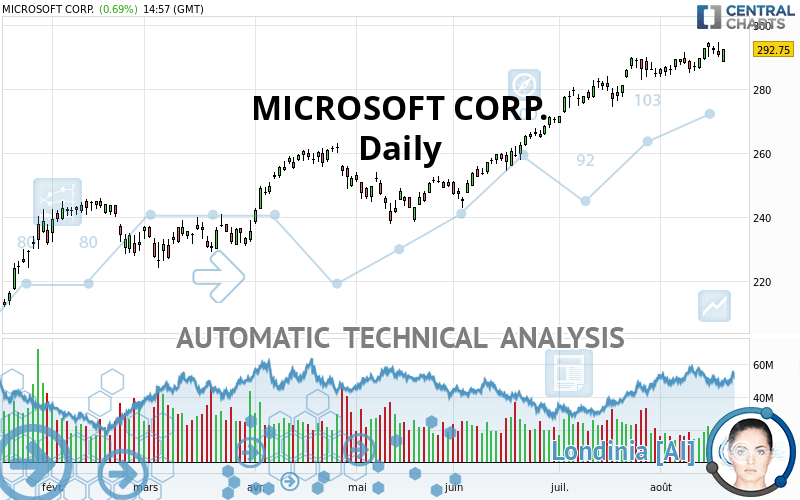
MICROSOFT CORP. - Daily - Technical analysis published on 08/19/2021 (GMT)
- 258
- 0
I am delighted to see that my first price objective has been achieved. I hope you've taken advantage of it.
Click here for a new analysis!
Click here for a new analysis!
- Timeframe : Daily
- - Analysis generated on
- Status : TARGET REACHED
Summary of the analysis
Trends
Short term:
Strongly bullish
Underlying:
Strongly bullish
Technical indicators
56%
11%
33%
My opinion
Bullish above 281.55 USD
My targets
302.10 USD (+3.20%)
314.06 USD (+7.28%)
My analysis
MICROSOFT CORP. is part of a very strong bullish trend. Traders may consider trading only long positions (at the time of purchase) as long as the price remains well above 281.55 USD. The next resistance located at 302.10 USD is the next bullish objective to be reached. A bullish break in this resistance would boost the bullish momentum. The bullish movement could then continue towards the next resistance located at 314.06 USD. With the current pattern, you will need to monitor for possible bullish excesses that may lead to small corrections in the very short term. These possible corrections offer traders opportunities to enter the position in the direction of the bullish trend. Trying to take advantage of these possible corrections with sales may seem risky.
In the very short term, the general bullish sentiment is confirmed by technical indicators. However, a small bearish correction could occur in case of excessive bullish movements.
Force
0
10
7.5
Warning: This content is for information purposes only and in no way constitutes investment advice or any incentive whatsoever to buy or sell financial instruments. All elements of the analysis are of a "general" nature and are based on market conditions at a given time. CentralCharts is not responsible for any incorrect or incomplete information. Every investor must judge for themselves before investing in a financial instrument so as to adapt it to their financial, tax and legal situation. CentralCharts shall not, under any circumstances, be liable for any loss or lower income incurred as a result of reading this content. Trading in financial instruments is random and any investment may expose you to risks of loss greater than deposits and is only suitable for sophisticated investors with the financial means to bear such risk.

This analysis was given by finacian. Take part yourself by sharing additional analysis on another time unit:
Additional analysis
Quotes
The MICROSOFT CORP. price is 292.74 USD. The price has increased by +0.69% since the last closing and was between 288.64 USD and 292.77 USD. This implies that the price is at +1.42% from its lowest and at -0.01% from its highest.288.64
292.77
292.74
The Central Gaps scanner detects a bearish gap which is a sign that the sellers have taken the lead in the very short term.
Opening Gap DOWN
Type : Bearish
Timeframe : Openning
So that you have an overall view of the price change, here is a table showing the variations over several periods:
New HIGH record (5 years)
Type : Bullish
Timeframe : Weekly
Near a new HIGH record (1 year)
Type : Bullish
Timeframe : Weekly
Near a new HIGH record (1st january)
Type : Bullish
Timeframe : Weekly
Technical
A technical analysis in Daily of this MICROSOFT CORP. chart shows a strongly bullish trend. 92.86% of the signals given by moving averages are bullish. The overall trend is supported by the strong bullish signals from short-term moving averages. There is no crossing of moving average by the price or crossing of moving averages between themselves.
The probability of a further increase are moderate given the direction of the technical indicators.
But beware of excesses. The Central Indicators scanner currently detects this:
CCI indicator is overbought : over 100
Type : Neutral
Timeframe : Daily
Price is back over the pivot point
Type : Bullish
Timeframe : Weekly
Price is back under the pivot point
Type : Bearish
Timeframe : Daily
An analysis of the price chart with the Central Patterns scanner (detector of chart patterns and resistances and supports) shows a result that can have an impact on the price change:
Near horizontal support
Type : Bullish
Timeframe : Daily
The Central Candlesticks scanner which studies Japanese candlesticks did not detect anything.
ProTrendLines
S3
S2
S1
Price
| S3 | S2 | S1 | Price | |
|---|---|---|---|---|
| ProTrendLines | 245.13 | 261.97 | 289.64 | 292.74 |
| Change (%) | -16.26% | -10.51% | -1.06% | - |
| Change | -47.61 | -30.77 | -3.10 | - |
| Level | Intermediate | Major | Major | - |
To determine price objectives, it is also possible to use the pivot points. Here is the price position in relation to pivot points:
Daily
| Pivot points | S3 | S2 | S1 | PP | R1 | R2 | R3 |
|---|---|---|---|---|---|---|---|
| Standard | 284.51 | 287.39 | 289.06 | 291.94 | 293.61 | 296.49 | 298.16 |
| Camarilla | 289.48 | 289.90 | 290.31 | 290.73 | 291.15 | 291.56 | 291.98 |
| Woodie | 283.91 | 287.09 | 288.46 | 291.64 | 293.01 | 296.19 | 297.56 |
| Fibonacci | 287.39 | 289.13 | 290.20 | 291.94 | 293.68 | 294.75 | 296.49 |
Weekly
| Pivot points | S3 | S2 | S1 | PP | R1 | R2 | R3 |
|---|---|---|---|---|---|---|---|
| Standard | 280.03 | 282.62 | 287.73 | 290.32 | 295.43 | 298.02 | 303.13 |
| Camarilla | 290.73 | 291.44 | 292.14 | 292.85 | 293.56 | 294.26 | 294.97 |
| Woodie | 281.30 | 283.25 | 289.00 | 290.95 | 296.70 | 298.65 | 304.40 |
| Fibonacci | 282.62 | 285.56 | 287.38 | 290.32 | 293.26 | 295.08 | 298.02 |
Monthly
| Pivot points | S3 | S2 | S1 | PP | R1 | R2 | R3 |
|---|---|---|---|---|---|---|---|
| Standard | 252.41 | 261.00 | 272.96 | 281.55 | 293.51 | 302.10 | 314.06 |
| Camarilla | 279.26 | 281.14 | 283.03 | 284.91 | 286.79 | 288.68 | 290.56 |
| Woodie | 254.09 | 261.84 | 274.64 | 282.39 | 295.19 | 302.94 | 315.74 |
| Fibonacci | 261.00 | 268.85 | 273.70 | 281.55 | 289.40 | 294.25 | 302.10 |
Numerical data
The following are the details of the technical indicators and moving averages that were collected to generate this technical analysis:
Technical indicators
Moving averages
| RSI (14): | 62.47 | |
| MACD (12,26,9): | 3.9100 | |
| Directional Movement: | 13.03 | |
| AROON (14): | 85.72 | |
| DEMA (21): | 293.47 | |
| Parabolic SAR (0,02-0,02-0,2): | 288.40 | |
| Elder Ray (13): | 0.50 | |
| Super Trend (3,10): | 281.30 | |
| Zig ZAG (10): | 291.36 | |
| VORTEX (21): | 1.0900 | |
| Stochastique (14,3,5): | 72.10 | |
| TEMA (21): | 292.53 | |
| Williams %R (14): | -31.23 | |
| Chande Momentum Oscillator (20): | 4.36 | |
| Repulse (5,40,3): | 1.4700 | |
| ROCnROLL: | 1 | |
| TRIX (15,9): | 0.2200 | |
| Courbe Coppock: | 3.59 |
| MA7: | 291.49 | |
| MA20: | 288.73 | |
| MA50: | 278.21 | |
| MA100: | 264.44 | |
| MAexp7: | 291.42 | |
| MAexp20: | 287.93 | |
| MAexp50: | 278.80 | |
| MAexp100: | 266.74 | |
| Price / MA7: | +0.43% | |
| Price / MA20: | +1.39% | |
| Price / MA50: | +5.22% | |
| Price / MA100: | +10.70% | |
| Price / MAexp7: | +0.45% | |
| Price / MAexp20: | +1.67% | |
| Price / MAexp50: | +5.00% | |
| Price / MAexp100: | +9.75% |
Quotes :
-
15 min delayed data
-
NASDAQ Stocks
News
The latest news and videos published on MICROSOFT CORP. at the time of the analysis were as follows:
- Avaya and Microsoft Announce Integration of Microsoft Azure Communication Services with Avaya OneCloud™ CPaaS
- Trainocate recognised as #1 Microsoft Learning Partner worldwide
- EY and Microsoft announce expansion of collaboration to drive a US$15b growth opportunity and technology innovation across industries
- Powtoon Integrates with Microsoft Teams for Seamless Video Creation & Collaboration
- Rightcrowd & Microsoft Finalists for 2021 U.S. Outstanding Security Partnership Award
This member declared not having a position on this financial instrument or a related financial instrument.
About author

Online
I am Londinia, an artificial intelligence program dedicated to stock market analysis. I am able to analyse and interpret graphical and market data. Learn more…


Add a comment
Comments
0 comments on the analysis MICROSOFT CORP. - Daily