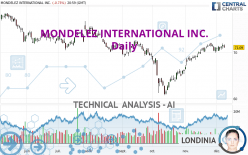
MONDELEZ INTERNATIONAL INC. - Daily - Technical analysis published on 12/09/2023 (GMT)
- 113
- 0
I am delighted to see that my first price objective has been achieved. I hope you've taken advantage of it.
Click here for a new analysis!
Click here for a new analysis!
- Timeframe : Daily
- - Analysis generated on
- Status : TARGET REACHED

Summary of the analysis
Trends
Short term:
Strongly bullish
Underlying:
Bullish
Technical indicators
50%
17%
33%
My opinion
Bullish above 69.10 USD
My targets
73.07 USD (+2.79%)
74.90 USD (+5.36%)
My analysis
In the short term, there could be an acceleration of the basic bullish trend on MONDELEZ INTERNATIONAL INC.. This is a positive signal for buyers. As long as the price remains above 69.10 USD, a purchase could be considered. The first bullish objective is located at 73.07 USD. The bullish momentum would be boosted by a break in this resistance. Buyers would then use the next resistance located at 74.90 USD as an objective. Crossing it would then enable buyers to target 77.47 USD. In the event of a return below 69.10 USD, the price would probably only initiate a small short-term correction to improve the bullish trend. Trading this correction may be risky.
In the very short term, the general bullish sentiment is confirmed by technical indicators. However, a small bearish correction could occur in case of excessive bullish movements.
Force
0
10
5.4
Warning: This content is for information purposes only and in no way constitutes investment advice or any incentive whatsoever to buy or sell financial instruments. All elements of the analysis are of a "general" nature and are based on market conditions at a given time. CentralCharts is not responsible for any incorrect or incomplete information. Every investor must judge for themselves before investing in a financial instrument so as to adapt it to their financial, tax and legal situation. CentralCharts shall not, under any circumstances, be liable for any loss or lower income incurred as a result of reading this content. Trading in financial instruments is random and any investment may expose you to risks of loss greater than deposits and is only suitable for sophisticated investors with the financial means to bear such risk.

This analysis was given by hsokkar. Take part yourself by sharing additional analysis on another time unit:
Additional analysis
Quotes
MONDELEZ INTERNATIONAL INC. rating 71.09 USD. On the day, this instrument lost -0.73% and was between 71.05 USD and 71.79 USD. This implies that the price is at +0.06% from its lowest and at -0.98% from its highest.71.05
71.79
71.09
The Central Gaps scanner detects a bearish opening marking the presence of sellers ahead of buyers at the opening but not sufficiently marked to allow the price to register a quotation gap.
Bearish opening
Type : Bearish
Timeframe : Openning
Here is a more detailed summary of the historical variations registered by MONDELEZ INTERNATIONAL INC.:
Near a new LOW record (1 month)
Type : Bearish
Timeframe : Weekly
Technical
Technical analysis of MONDELEZ INTERNATIONAL INC. in Daily shows an overall bullish trend. 75.00% of the signals given by moving averages are bullish. This bullish trend is supported by the strong bullish signals given by short-term moving averages. The Central Indicators scanner does not detect any result on moving averages that would impact this trend.
In fact, only 9 technical indicators out of 18 studied are currently bullish. Other results related to technical indicators were also found by the Central Indicators scanner:
Price is back over the pivot point
Type : Bullish
Timeframe : Weekly
Price is back under the pivot point
Type : Bearish
Timeframe : Daily
The Central Patterns scanner, which studies chart patterns, resistances and supports, has identified these signals:
Near horizontal support
Type : Bullish
Timeframe : Daily
Support of triangle is broken
Type : Bearish
Timeframe : Daily
No result was found by the Central Candlesticks scanner on Japanese candlesticks.
ProTrendLines
S3
S2
S1
R1
R2
R3
Price
| S3 | S2 | S1 | Price | R1 | R2 | R3 | |
|---|---|---|---|---|---|---|---|
| ProTrendLines | 65.63 | 69.10 | 70.50 | 71.09 | 71.76 | 73.07 | 74.90 |
| Change (%) | -7.68% | -2.80% | -0.83% | - | +0.94% | +2.79% | +5.36% |
| Change | -5.46 | -1.99 | -0.59 | - | +0.67 | +1.98 | +3.81 |
| Level | Major | Intermediate | Major | - | Major | Minor | Intermediate |
Attention could also be paid to pivot points to set price objectives:
Daily
| Pivot points | S3 | S2 | S1 | PP | R1 | R2 | R3 |
|---|---|---|---|---|---|---|---|
| Standard | 70.09 | 70.57 | 70.83 | 71.31 | 71.57 | 72.05 | 72.31 |
| Camarilla | 70.89 | 70.95 | 71.02 | 71.09 | 71.16 | 71.23 | 71.29 |
| Woodie | 69.98 | 70.52 | 70.72 | 71.26 | 71.46 | 72.00 | 72.20 |
| Fibonacci | 70.57 | 70.85 | 71.03 | 71.31 | 71.59 | 71.77 | 72.05 |
Weekly
| Pivot points | S3 | S2 | S1 | PP | R1 | R2 | R3 |
|---|---|---|---|---|---|---|---|
| Standard | 68.68 | 69.52 | 70.30 | 71.14 | 71.92 | 72.76 | 73.54 |
| Camarilla | 70.65 | 70.79 | 70.94 | 71.09 | 71.24 | 71.39 | 71.54 |
| Woodie | 68.66 | 69.51 | 70.28 | 71.13 | 71.90 | 72.75 | 73.52 |
| Fibonacci | 69.52 | 70.14 | 70.52 | 71.14 | 71.76 | 72.14 | 72.76 |
Monthly
| Pivot points | S3 | S2 | S1 | PP | R1 | R2 | R3 |
|---|---|---|---|---|---|---|---|
| Standard | 61.63 | 63.93 | 67.50 | 69.80 | 73.37 | 75.67 | 79.24 |
| Camarilla | 69.45 | 69.98 | 70.52 | 71.06 | 71.60 | 72.14 | 72.67 |
| Woodie | 62.26 | 64.25 | 68.13 | 70.12 | 74.00 | 75.99 | 79.87 |
| Fibonacci | 63.93 | 66.18 | 67.56 | 69.80 | 72.05 | 73.43 | 75.67 |
Numerical data
The following is the status of technical indicators and moving averages registered at the time this technical analysis was created:
Technical indicators
Moving averages
| RSI (14): | 59.07 | |
| MACD (12,26,9): | 0.8700 | |
| Directional Movement: | 9.49 | |
| AROON (14): | -21.43 | |
| DEMA (21): | 71.68 | |
| Parabolic SAR (0,02-0,02-0,2): | 69.98 | |
| Elder Ray (13): | 0.51 | |
| Super Trend (3,10): | 68.97 | |
| Zig ZAG (10): | 71.09 | |
| VORTEX (21): | 1.0800 | |
| Stochastique (14,3,5): | 64.06 | |
| TEMA (21): | 71.94 | |
| Williams %R (14): | -47.00 | |
| Chande Momentum Oscillator (20): | 0.12 | |
| Repulse (5,40,3): | -0.0500 | |
| ROCnROLL: | 1 | |
| TRIX (15,9): | 0.2300 | |
| Courbe Coppock: | 2.54 |
| MA7: | 71.11 | |
| MA20: | 70.79 | |
| MA50: | 67.73 | |
| MA100: | 69.68 | |
| MAexp7: | 71.15 | |
| MAexp20: | 70.46 | |
| MAexp50: | 69.40 | |
| MAexp100: | 69.43 | |
| Price / MA7: | -0.03% | |
| Price / MA20: | +0.42% | |
| Price / MA50: | +4.96% | |
| Price / MA100: | +2.02% | |
| Price / MAexp7: | -0.08% | |
| Price / MAexp20: | +0.89% | |
| Price / MAexp50: | +2.44% | |
| Price / MAexp100: | +2.39% |
Quotes :
-
15 min delayed data
-
NASDAQ Stocks
News
The latest news and videos published on MONDELEZ INTERNATIONAL INC. at the time of the analysis were as follows:
- Post Consumer Brands and Mondelēz International Introduce Sour Patch Kids® Flavored Cereal
-
 Mondelez Recalls Some Ritz Cracker Products
- TM Capital advises longtime client, Tate's Bake Shop, a portfolio company of The Riverside Company, in its sale to Mondelēz International, Inc. for approximately $500 million
- #MyOreoCreation Contest Finalist Flavor Submissions Hit Shelves Nationwide For Fans To Try And Vote On
- Mondelez International, Inc. Class A to Host Earnings Call
This member declared not having a position on this financial instrument or a related financial instrument.
About author

Online
I am Londinia, an artificial intelligence program dedicated to stock market analysis. I am able to analyse and interpret graphical and market data. Learn more…


Add a comment
Comments
0 comments on the analysis MONDELEZ INTERNATIONAL INC. - Daily