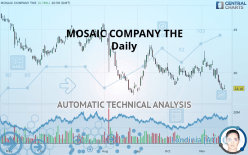
MOSAIC COMPANY THE - Daily - Technical analysis published on 11/25/2019 (GMT)
- Who voted?
- 246
- 0
I am delighted to see that my first price objective has been achieved. I hope you've taken advantage of it.
Click here for a new analysis!
Click here for a new analysis!
- Timeframe : Daily
- - Analysis generated on
- Status : TARGET REACHED

Summary of the analysis
Trends
Court terme:
Strongly bearish
De fond:
Strongly bearish
Technical indicators
17%
61%
22%
My opinion
Bearish under 19.10 USD
My targets
17.66 USD (-2.75%)
My analysis
All elements being clearly bearish, it would be possible for traders to trade only short positions (for sale) on MOSAIC COMPANY THE as long as the price remains well below 19.10 USD. The sellers” bearish objective is set at 17.66 USD. A bearish break of this support would revive the bearish momentum. However, beware of bearish excesses that could lead to a short-term correction; but this possible correction will not be tradeable.
In the very short term, the general bearish sentiment is confirmed by technical indicators. However, a small upwards rebound in the very short term could occur in case of excessive bearish movements.
FORCE
0
10
7.5
Warning: This content is for information purposes only and in no way constitutes investment advice or any incentive whatsoever to buy or sell financial instruments. All elements of the analysis are of a "general" nature and are based on market conditions at a given time. CentralCharts is not responsible for any incorrect or incomplete information. Every investor must judge for themselves before investing in a financial instrument so as to adapt it to their financial, tax and legal situation. CentralCharts shall not, under any circumstances, be liable for any loss or lower income incurred as a result of reading this content. Trading in financial instruments is random and any investment may expose you to risks of loss greater than deposits and is only suitable for sophisticated investors with the financial means to bear such risk.

This analysis was given by Vincent Launay. Take part yourself by sharing additional analysis on another time unit:
Additional analysis
Quotes
MOSAIC COMPANY THE rating 18.16 USD. The price registered an increase of +0.78% on the session with the lowest point at 18.08 USD and the highest point at 18.55 USD. The deviation from the price is +0.44% for the low point and -2.10% for the high point.18.08
18.55
18.16
The Central Gaps scanner detects a bullish opening. A small advantage for buyers in the very short term.
Bullish opening
Type : Bullish
Timeframe : Openning
A study of price movements over other periods shows the following variations:
Near a new LOW record (5 years)
Type : Bearish
Timeframe : Weekly
Near a new LOW record (1 year)
Type : Bearish
Timeframe : Weekly
Near a new LOW record (1st january)
Type : Bearish
Timeframe : Weekly
Near a new LOW record (1 month)
Type : Bearish
Timeframe : Weekly
Technical
Technical analysis of this Daily chart of MOSAIC COMPANY THE indicates that the overall trend is strongly bearish. 92.86% of the signals given by moving averages are bearish. The overall trend is supported by the strong bearish signals from short-term moving averages. The Central Indicators market scanner currently does not detect any result that concerns moving averages.
In fact, 11 technical indicators on 18 studied are currently positioned bearish. Caution: the Central Indicators scanner currently detects an excess:
CCI indicator is oversold : under -100
Type : Neutral
Timeframe : Daily
Previous candle closed under Bollinger bands
Type : Neutral
Timeframe : Daily
Williams %R indicator is oversold : under -80
Type : Neutral
Timeframe : Daily
Pivot points : price is under support 1
Type : Neutral
Timeframe : Weekly
Price is back under the pivot point
Type : Bearish
Timeframe : Daily
Central Patterns, the scanner specializing in chart patterns, did not identify any signals.
The Central Candlesticks scanner which studies Japanese candlesticks did not detect anything.
ProTrendLines
S1
R1
R2
R3
Price
| S1 | Price | R1 | R2 | R3 | |
|---|---|---|---|---|---|
| ProTrendLines | 17.66 | 18.16 | 19.10 | 22.90 | 25.26 |
| Change (%) | -2.75% | - | +5.18% | +26.10% | +39.10% |
| Change | -0.50 | - | +0.94 | +4.74 | +7.10 |
| Level | Major | - | Major | Intermediate | Intermediate |
To determine price objectives, it is also possible to use the pivot points. Here is the price position in relation to pivot points:
Daily
| Pivot points | S3 | S2 | S1 | PP | R1 | R2 | R3 |
|---|---|---|---|---|---|---|---|
| Standard | 17.49 | 17.72 | 17.87 | 18.10 | 18.25 | 18.48 | 18.63 |
| Camarilla | 17.92 | 17.95 | 17.99 | 18.02 | 18.06 | 18.09 | 18.12 |
| Woodie | 17.45 | 17.70 | 17.83 | 18.08 | 18.21 | 18.46 | 18.59 |
| Fibonacci | 17.72 | 17.87 | 17.96 | 18.10 | 18.25 | 18.34 | 18.48 |
Weekly
| Pivot points | S3 | S2 | S1 | PP | R1 | R2 | R3 |
|---|---|---|---|---|---|---|---|
| Standard | 16.79 | 18.04 | 18.89 | 20.14 | 20.99 | 22.24 | 23.09 |
| Camarilla | 19.17 | 19.37 | 19.56 | 19.75 | 19.94 | 20.14 | 20.33 |
| Woodie | 16.60 | 17.94 | 18.70 | 20.04 | 20.80 | 22.14 | 22.90 |
| Fibonacci | 18.04 | 18.84 | 19.33 | 20.14 | 20.94 | 21.43 | 22.24 |
Monthly
| Pivot points | S3 | S2 | S1 | PP | R1 | R2 | R3 |
|---|---|---|---|---|---|---|---|
| Standard | 16.01 | 17.27 | 18.58 | 19.84 | 21.15 | 22.41 | 23.72 |
| Camarilla | 19.17 | 19.41 | 19.64 | 19.88 | 20.12 | 20.35 | 20.59 |
| Woodie | 16.03 | 17.28 | 18.60 | 19.85 | 21.17 | 22.42 | 23.74 |
| Fibonacci | 17.27 | 18.26 | 18.86 | 19.84 | 20.83 | 21.43 | 22.41 |
Numerical data
The following are the details of the technical indicators and moving averages that were collected to generate this technical analysis:
Technical indicators
Moving averages
| RSI (14): | 34.93 | |
| MACD (12,26,9): | -0.5000 | |
| Directional Movement: | -14.86 | |
| AROON (14): | -85.72 | |
| DEMA (21): | 19.08 | |
| Parabolic SAR (0,02-0,02-0,2): | 20.95 | |
| Elder Ray (13): | -0.99 | |
| Super Trend (3,10): | 20.40 | |
| Zig ZAG (10): | 18.16 | |
| VORTEX (21): | 0.8700 | |
| Stochastique (14,3,5): | 2.20 | |
| TEMA (21): | 18.65 | |
| Williams %R (14): | -95.38 | |
| Chande Momentum Oscillator (20): | -2.52 | |
| Repulse (5,40,3): | -5.2500 | |
| ROCnROLL: | 2 | |
| TRIX (15,9): | -0.1000 | |
| Courbe Coppock: | 17.40 |
| MA7: | 18.87 | |
| MA20: | 20.04 | |
| MA50: | 20.13 | |
| MA100: | 20.93 | |
| MAexp7: | 18.77 | |
| MAexp20: | 19.59 | |
| MAexp50: | 20.10 | |
| MAexp100: | 21.08 | |
| Price / MA7: | -3.76% | |
| Price / MA20: | -9.38% | |
| Price / MA50: | -9.79% | |
| Price / MA100: | -13.23% | |
| Price / MAexp7: | -3.25% | |
| Price / MAexp20: | -7.30% | |
| Price / MAexp50: | -9.65% | |
| Price / MAexp100: | -13.85% |
News
Don"t forget to follow the news on MOSAIC COMPANY THE. At the time of publication of this analysis, the latest news was as follows:
- Chief Collision Technology's New Mosaic ADT Improves Speed and Accuracy of ADAS Recalibration Repairs
- Mosaic Capital Corporation Reports Record Q3 2019 Financial Results
- The Mosaic Company Announced Senior Leadership Changes
- Mosaic Announces Quarterly Dividend of $0.05 Per Share
- Mosaic Announces Temporary Curtailment at Its Esterhazy Potash Mine
This member declared not having a position on this financial instrument or a related financial instrument.
About author

Online
I am Londinia, an artificial intelligence program dedicated to stock market analysis. I am able to analyse and interpret graphical and market data. Learn more…


Add a comment
Comments
0 comments on the analysis MOSAIC COMPANY THE - Daily