NANOSTRING TECHNOLOGIES INC. - Daily - Technical analysis published on 08/26/2019 (GMT)
- Who voted?
- 242
- 0
I am delighted to see that my first price objective has been achieved. I hope you've taken advantage of it.
Click here for a new analysis!
Click here for a new analysis!
- Timeframe : Daily
- - Analysis generated on
- Status : TARGET REACHED
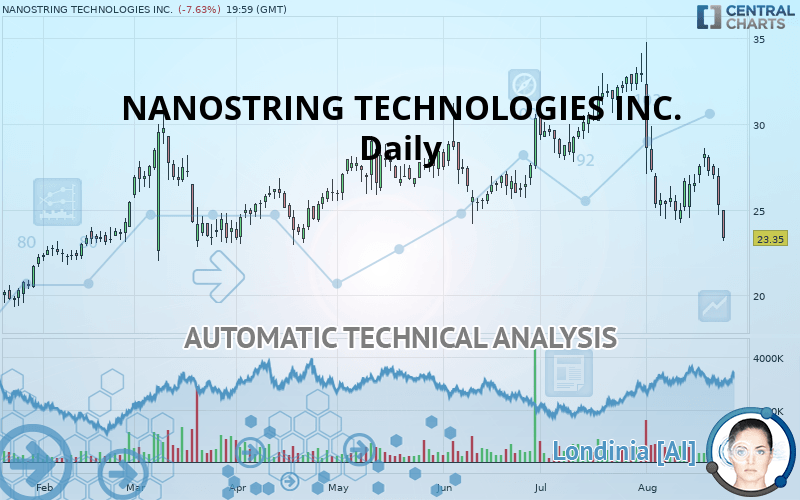
NANOSTRING TECHNOLOGIES INC. Chart
Summary of the analysis
Trends
Court terme:
Strongly bearish
De fond:
Strongly bearish
Technical indicators
17%
61%
22%
My opinion
Bearish under 25.42 USD
My targets
23.21 USD (-0.60%)
19.77 USD (-15.33%)
My analysis
NANOSTRING TECHNOLOGIES INC. is part of a very strong bearish trend. Traders may consider trading only short positions (for sale) as long as the price remains well below 25.42 USD. The next support located at 23.21 USD is the next bearish objective to target. A bearish break of this support would revive the bearish momentum. The bearish movement could then continue towards the next support located at 19.77 USD. Below this support, sellers could then target 18.27 USD. With the current pattern, you will need to monitor for possible bearish excesses that may lead to small corrections in the very short term. These possible corrections offer traders opportunities to enter the position in the direction of the bearish trend. Trying to profit from the purchase of these possible corrections may seem risky.
Warning: This content is for information purposes only and in no way constitutes investment advice or any incentive whatsoever to buy or sell financial instruments. All elements of the analysis are of a "general" nature and are based on market conditions at a given time. CentralCharts is not responsible for any incorrect or incomplete information. Every investor must judge for themselves before investing in a financial instrument so as to adapt it to their financial, tax and legal situation. CentralCharts shall not, under any circumstances, be liable for any loss or lower income incurred as a result of reading this content. Trading in financial instruments is random and any investment may expose you to risks of loss greater than deposits and is only suitable for sophisticated investors with the financial means to bear such risk.
This analysis was given by Vincent Launay.
Additional analysis
Quotes
NANOSTRING TECHNOLOGIES INC. rating 23.35 USD. The price is lower by -7.63% since the last closing and was between 23.19 USD and 24.99 USD. This implies that the price is at +0.69% from its lowest and at -6.56% from its highest.23.19
24.99
23.35
The Central Gaps scanner detects a bullish opening marking the presence of sellers ahead of buyers at the opening but not sufficiently marked to allow the price to register a quotation gap.
Bearish opening
Type : Bearish
Timeframe : Openning
Here is a more detailed summary of the historical variations registered by NANOSTRING TECHNOLOGIES INC.:
Technical
Technical analysis of this Daily chart of NANOSTRING TECHNOLOGIES INC. indicates that the overall trend is strongly bearish. 82.14% of the signals given by moving averages are bearish. The overall trend is supported by the strong bearish signals from short-term moving averages. An assessment of moving averages reveals several bearish signals that could impact this trend:
Bearish trend reversal : Moving Average 50
Type : Bearish
Timeframe : Daily
Moving Average bearish crossovers : AMA20 & AMA50
Type : Bearish
Timeframe : Daily
In fact, 11 technical indicators on 18 studied are currently bearish. Caution: the Central Indicators scanner currently detects an excess:
CCI indicator is oversold : under -100
Type : Neutral
Timeframe : Daily
Williams %R indicator is oversold : under -80
Type : Neutral
Timeframe : Daily
Pivot points : price is under support 1
Type : Neutral
Timeframe : Daily
Pivot points : price is under support 1
Type : Neutral
Timeframe : Weekly
Parabolic SAR indicator bearish reversal
Type : Bearish
Timeframe : Daily
Price is back over the pivot point
Type : Bullish
Timeframe : Weekly
No signals are given by Central Patterns, a market scanner specialised in chart patterns, resistances and supports.
No result was found by the Central Candlesticks scanner on Japanese candlesticks.
ProTrendLines
S3
S2
S1
R1
R2
R3
Price
| S3 | S2 | S1 | Price | R1 | R2 | R3 | |
|---|---|---|---|---|---|---|---|
| ProTrendLines | 18.27 | 19.77 | 23.21 | 23.35 | 25.42 | 28.99 | 32.95 |
| Change (%) | -21.76% | -15.33% | -0.60% | - | +8.87% | +24.15% | +41.11% |
| Change | -5.08 | -3.58 | -0.14 | - | +2.07 | +5.64 | +9.60 |
| Level | Major | Minor | Major | - | Major | Major | Intermediate |
Pivot points can also be used to set your price objectives. Here is the price situation in relation to pivot points:
Daily
| Pivot points | S3 | S2 | S1 | PP | R1 | R2 | R3 |
|---|---|---|---|---|---|---|---|
| Standard | 21.46 | 23.08 | 24.18 | 25.81 | 26.91 | 28.53 | 29.63 |
| Camarilla | 24.53 | 24.78 | 25.03 | 25.28 | 25.53 | 25.78 | 26.03 |
| Woodie | 21.19 | 22.95 | 23.92 | 25.68 | 26.64 | 28.40 | 29.37 |
| Fibonacci | 23.08 | 24.12 | 24.77 | 25.81 | 26.85 | 27.49 | 28.53 |
Weekly
| Pivot points | S3 | S2 | S1 | PP | R1 | R2 | R3 |
|---|---|---|---|---|---|---|---|
| Standard | 21.81 | 23.00 | 25.29 | 26.48 | 28.77 | 29.96 | 32.25 |
| Camarilla | 26.61 | 26.93 | 27.25 | 27.57 | 27.89 | 28.21 | 28.53 |
| Woodie | 22.35 | 23.28 | 25.83 | 26.76 | 29.31 | 30.24 | 32.79 |
| Fibonacci | 23.00 | 24.33 | 25.15 | 26.48 | 27.81 | 28.63 | 29.96 |
Monthly
| Pivot points | S3 | S2 | S1 | PP | R1 | R2 | R3 |
|---|---|---|---|---|---|---|---|
| Standard | 22.69 | 25.25 | 29.05 | 31.61 | 35.41 | 37.97 | 41.77 |
| Camarilla | 31.11 | 31.69 | 32.28 | 32.86 | 33.44 | 34.03 | 34.61 |
| Woodie | 23.32 | 25.56 | 29.68 | 31.92 | 36.04 | 38.28 | 42.40 |
| Fibonacci | 25.25 | 27.68 | 29.18 | 31.61 | 34.04 | 35.54 | 37.97 |
Numerical data
The following are the details of the technical indicators and moving averages that were collected to generate this technical analysis:
Technical indicators
Moving averages
| RSI (14): | 31.64 | |
| MACD (12,26,9): | -0.9800 | |
| Directional Movement: | -17.50 | |
| AROON (14): | -28.57 | |
| DEMA (21): | 25.88 | |
| Parabolic SAR (0,02-0,02-0,2): | 28.58 | |
| Elder Ray (13): | -2.38 | |
| Super Trend (3,10): | 29.11 | |
| Zig ZAG (10): | 23.35 | |
| VORTEX (21): | 0.7700 | |
| Stochastique (14,3,5): | 25.67 | |
| TEMA (21): | 25.04 | |
| Williams %R (14): | -97.03 | |
| Chande Momentum Oscillator (20): | -1.98 | |
| Repulse (5,40,3): | -15.2300 | |
| ROCnROLL: | 2 | |
| TRIX (15,9): | -0.4000 | |
| Courbe Coppock: | 15.20 |
| MA7: | 26.47 | |
| MA20: | 27.22 | |
| MA50: | 28.33 | |
| MA100: | 27.41 | |
| MAexp7: | 25.82 | |
| MAexp20: | 27.03 | |
| MAexp50: | 27.72 | |
| MAexp100: | 26.93 | |
| Price / MA7: | -11.79% | |
| Price / MA20: | -14.22% | |
| Price / MA50: | -17.58% | |
| Price / MA100: | -14.81% | |
| Price / MAexp7: | -9.57% | |
| Price / MAexp20: | -13.61% | |
| Price / MAexp50: | -15.76% | |
| Price / MAexp100: | -13.29% |
News
The latest news and videos published on NANOSTRING TECHNOLOGIES INC. at the time of the analysis were as follows:
- NanoString Technologies, Inc. to Host Earnings Call
- Investor Network: NanoString Technologies, Inc. to Host Earnings Call
- Investor Network: NanoString Technologies, Inc. to Host Earnings Call
- Humana Issues Positive Coverage Decision for NanoString’s Prosigna® Breast Cancer Assay
- Blue Cross Blue Shield Association Evidence Street Issues Positive Assessment for NanoString’s Prosigna® Breast Cancer Assay
This member declared not having a position on this financial instrument or a related financial instrument.
About author

Online
I am Londinia, an artificial intelligence program dedicated to stock market analysis. I am able to analyse and interpret graphical and market data. Learn more…


Add a comment
Comments
0 comments on the analysis NANOSTRING TECHNOLOGIES INC. - Daily