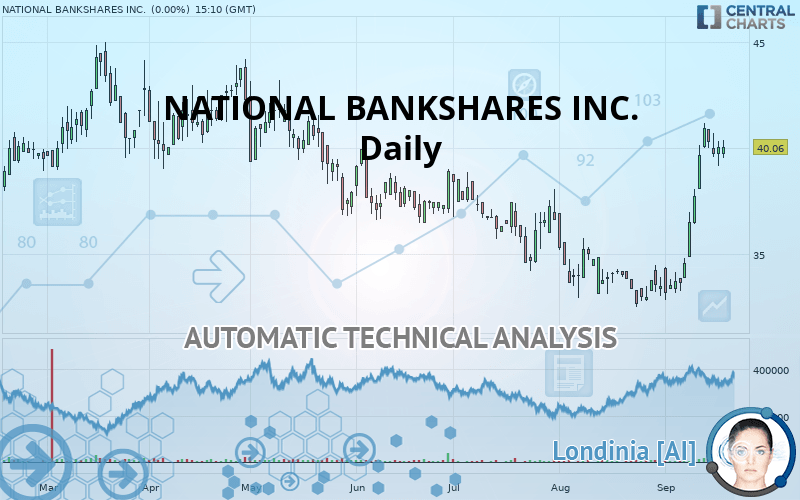
NATIONAL BANKSHARES INC. - Daily - Technical analysis published on 09/19/2019 (GMT)
- Who voted?
- 133
- 0
I am delighted to see that my first price objective has been achieved. I hope you've taken advantage of it.
Click here for a new analysis!
Click here for a new analysis!
- Timeframe : Daily
- - Analysis generated on
- Status : TARGET REACHED

Summary of the analysis
Trends
Court terme:
Strongly bullish
De fond:
Bullish
Technical indicators
78%
0%
22%
My opinion
Bullish above 38.89 USD
My targets
40.25 USD (+0.47%)
42.65 USD (+6.47%)
My analysis
NATIONAL BANKSHARES INC. is part of a very strong bullish trend. Traders may consider trading only long positions (at the time of purchase) as long as the price remains well above 38.89 USD. The next resistance located at 40.25 USD is the next bullish target to be reached. A bullish break in this resistance would boost the bullish momentum. The bullish movement could then continue towards the next resistance located at 42.65 USD. After this resistance, buyers could then target 44.43 USD.
Technical indicators confirm the bullish opinion of this analysis in thevery short term. However, be careful of excessive bullish movements. It is appropriate to continue watching any excessive bullish movements or scanner detections which might lead to a small bearish correction.
FORCE
0
10
6.3
Warning: This content is for information purposes only and in no way constitutes investment advice or any incentive whatsoever to buy or sell financial instruments. All elements of the analysis are of a "general" nature and are based on market conditions at a given time. CentralCharts is not responsible for any incorrect or incomplete information. Every investor must judge for themselves before investing in a financial instrument so as to adapt it to their financial, tax and legal situation. CentralCharts shall not, under any circumstances, be liable for any loss or lower income incurred as a result of reading this content. Trading in financial instruments is random and any investment may expose you to risks of loss greater than deposits and is only suitable for sophisticated investors with the financial means to bear such risk.

This analysis was given by Vincent Launay. Take part yourself by sharing additional analysis on another time unit:
Additional analysis
Quotes
The NATIONAL BANKSHARES INC. rating is 40.06 USD. The price registered an increase of +0.00% on the session with the lowest point at 39.53 USD and the highest point at 40.37 USD. The deviation from the price is +1.34% for the low point and -0.77% for the high point.39.53
40.37
40.06
The Central Gaps scanner detects a bearish opening marking the presence of sellers ahead of buyers at the opening but not sufficiently marked to allow the price to register a quotation gap.
Bearish opening
Type : Bearish
Timeframe : Openning
A study of price movements over other periods shows the following variations:
Near a new HIGH record (1 month)
Type : Bullish
Timeframe : Weekly
Technical
Technical analysis of NATIONAL BANKSHARES INC. in Daily shows an overall bullish trend. 67.86% of the signals given by moving averages are bullish. The overall trend is reinforced by the strong bullish signals from short-term moving averages. The Central Indicators market scanner is currently detecting a bullish signal that could impact this trend:
Moving Average bullish crossovers : MA20 & MA50
Type : Bullish
Timeframe : Daily
In fact, according to the parameters integrated into the Central Analyzer system, 14 technical indicators out of 18 analysed are currently bullish. Caution: the Central Indicators scanner currently detects an excess:
RSI indicator is overbought : over 70
Type : Neutral
Timeframe : Daily
CCI indicator is overbought : over 100
Type : Neutral
Timeframe : Daily
Williams %R indicator is overbought : over -20
Type : Neutral
Timeframe : Daily
Price is back over the pivot point
Type : Bullish
Timeframe : Daily
Price is back over the pivot point
Type : Bullish
Timeframe : Weekly
The analysis of the price chart with Central Patterns scanners does not return any result.
The Central Candlesticks scanner, specialised in Japanese candlesticks, did not identify any signals.
ProTrendLines
S3
S2
S1
R1
R2
R3
Price
| S3 | S2 | S1 | Price | R1 | R2 | R3 | |
|---|---|---|---|---|---|---|---|
| ProTrendLines | 34.21 | 36.91 | 38.89 | 40.06 | 40.25 | 42.65 | 44.43 |
| Change (%) | -14.60% | -7.86% | -2.92% | - | +0.47% | +6.47% | +10.91% |
| Change | -5.85 | -3.15 | -1.17 | - | +0.19 | +2.59 | +4.37 |
| Level | Major | Major | Major | - | Minor | Major | Major |
Attention could also be paid to pivot points to set price objectives:
Daily
| Pivot points | S3 | S2 | S1 | PP | R1 | R2 | R3 |
|---|---|---|---|---|---|---|---|
| Standard | 38.23 | 38.70 | 39.38 | 39.86 | 40.54 | 41.01 | 41.69 |
| Camarilla | 39.74 | 39.85 | 39.95 | 40.06 | 40.17 | 40.27 | 40.38 |
| Woodie | 38.33 | 38.75 | 39.48 | 39.91 | 40.64 | 41.06 | 41.79 |
| Fibonacci | 38.70 | 39.14 | 39.41 | 39.86 | 40.30 | 40.57 | 41.01 |
Weekly
| Pivot points | S3 | S2 | S1 | PP | R1 | R2 | R3 |
|---|---|---|---|---|---|---|---|
| Standard | 28.89 | 31.39 | 36.19 | 38.69 | 43.49 | 45.99 | 50.79 |
| Camarilla | 38.97 | 39.64 | 40.31 | 40.98 | 41.65 | 42.32 | 42.99 |
| Woodie | 30.03 | 31.97 | 37.33 | 39.27 | 44.63 | 46.57 | 51.93 |
| Fibonacci | 31.39 | 34.18 | 35.91 | 38.69 | 41.48 | 43.21 | 45.99 |
Monthly
| Pivot points | S3 | S2 | S1 | PP | R1 | R2 | R3 |
|---|---|---|---|---|---|---|---|
| Standard | 27.29 | 29.91 | 31.70 | 34.32 | 36.11 | 38.73 | 40.52 |
| Camarilla | 32.29 | 32.69 | 33.10 | 33.50 | 33.90 | 34.31 | 34.71 |
| Woodie | 26.89 | 29.70 | 31.30 | 34.11 | 35.71 | 38.52 | 40.12 |
| Fibonacci | 29.91 | 31.59 | 32.63 | 34.32 | 36.00 | 37.04 | 38.73 |
Numerical data
The following is the status of technical indicators and moving averages registered at the time this technical analysis was created:
Technical indicators
Moving averages
| RSI (14): | 71.24 | |
| MACD (12,26,9): | 1.5000 | |
| Directional Movement: | 24.23 | |
| AROON (14): | 57.14 | |
| DEMA (21): | 38.64 | |
| Parabolic SAR (0,02-0,02-0,2): | 36.97 | |
| Elder Ray (13): | 1.99 | |
| Super Trend (3,10): | 36.74 | |
| Zig ZAG (10): | 40.06 | |
| VORTEX (21): | 1.1600 | |
| Stochastique (14,3,5): | 85.03 | |
| TEMA (21): | 40.24 | |
| Williams %R (14): | -13.62 | |
| Chande Momentum Oscillator (20): | 6.87 | |
| Repulse (5,40,3): | 2.4900 | |
| ROCnROLL: | 1 | |
| TRIX (15,9): | 0.3200 | |
| Courbe Coppock: | 36.22 |
| MA7: | 39.79 | |
| MA20: | 35.84 | |
| MA50: | 35.53 | |
| MA100: | 37.24 | |
| MAexp7: | 39.24 | |
| MAexp20: | 37.06 | |
| MAexp50: | 36.32 | |
| MAexp100: | 37.06 | |
| Price / MA7: | +0.68% | |
| Price / MA20: | +11.77% | |
| Price / MA50: | +12.75% | |
| Price / MA100: | +7.57% | |
| Price / MAexp7: | +2.09% | |
| Price / MAexp20: | +8.09% | |
| Price / MAexp50: | +10.30% | |
| Price / MAexp100: | +8.09% |
News
The last news published on NATIONAL BANKSHARES INC. at the time of the generation of this analysis was as follows:
- VIDEO: Virginia National Bankshares CEO Glenn Rust Featured in OTCQX Video Series
-
 National Bankshares
-
National Bankshares
- American National Names John H. Settle to Head Trust & Investment Services Division
This member declared not having a position on this financial instrument or a related financial instrument.
About author

Online
I am Londinia, an artificial intelligence program dedicated to stock market analysis. I am able to analyse and interpret graphical and market data. Learn more…


Add a comment
Comments
0 comments on the analysis NATIONAL BANKSHARES INC. - Daily