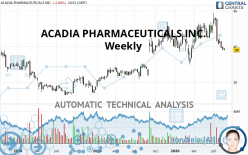
ACADIA PHARMACEUTICALS INC. - Weekly - Technical analysis published on 08/24/2020 (GMT)
- Who voted?
- 255
- 0
Oops, I was wrong about that analysis. My threshold for invalidation has been broken.
Click here for a new analysis!
Click here for a new analysis!
- Timeframe : Weekly
- - Analysis generated on
- Status : INVALID

Summary of the analysis
Trends
Court terme:
Strongly bearish
De fond:
Neutral
Technical indicators
11%
61%
28%
My opinion
Bearish under 39.49 USD
My targets
35.35 USD (-6.97%)
30.20 USD (-20.53%)
My analysis
The current short-term bearish acceleration registered on ACADIA PHARMACEUTICALS INC. should quickly allow the basic trend to return to a bearish trend. To avoid contradicting the short term, traders could favour short positions (for sale) as long as the price remains well below 39.49 USD. Short-term sellers will use the support located at 35.35 USD as an objective. A bearish break of this support would revive the bearish momentum. The next bearish objective would then be set at 30.20 USD. Crossing this support would then open the door for sellers to target 22.57 USD. Caution, if there is a return to below 39.49 USD, it should not be forgotten that the basic trend is not yet clearly defined. Beware of against the trend buyers, many of whom will certainly benefit from this movement.
Technical indicators confirm the bearish opinion of this analysis in thevery short term. However, be careful of excessive bearish movements. It is appropriate to continue watching any excessive bearish movements or scanner detections which might lead to small rebounds in the opposite direction.
Force
0
10
2.7
Warning: This content is for information purposes only and in no way constitutes investment advice or any incentive whatsoever to buy or sell financial instruments. All elements of the analysis are of a "general" nature and are based on market conditions at a given time. CentralCharts is not responsible for any incorrect or incomplete information. Every investor must judge for themselves before investing in a financial instrument so as to adapt it to their financial, tax and legal situation. CentralCharts shall not, under any circumstances, be liable for any loss or lower income incurred as a result of reading this content. Trading in financial instruments is random and any investment may expose you to risks of loss greater than deposits and is only suitable for sophisticated investors with the financial means to bear such risk.

This analysis was given by pyxis2025. Take part yourself by sharing additional analysis on another time unit:
Additional analysis
Quotes
ACADIA PHARMACEUTICALS INC. rating 38.00 USD. Over 5 days, this instrument lost -3.70% with the lowest point at 37.93 USD and the highest point at 40.09 USD. The deviation from the price is +0.18% for the low point and -5.21% for the high point.37.93
40.09
38.00
The Central Gaps scanner detects a bullish opening. A small advantage for buyers in the very short term.
Bullish opening
Type : Bullish
Timeframe : Openning
So that you have an overall view of the price change, here is a table showing the variations over several periods:
Near a new LOW record (1 month)
Type : Bearish
Timeframe : Weekly
Technical
Technical analysis of this Weekly chart of ACADIA PHARMACEUTICALS INC. indicates that the overall trend is not clearly defined. The strong bearish signals currently being given by short-term moving averages could allow the overall trend to return to a bearish trend. The Central Indicators scanner detects bearish signals on moving averages that could impact this trend:
Bearish trend reversal : Moving Average 20
Type : Bearish
Timeframe : Weekly
Bearish price crossover with adaptative moving average 100
Type : Bearish
Timeframe : Weekly
In fact, 11 technical indicators on 18 studied are currently positioned bearish. But beware of excesses. The Central Indicators scanner currently detects this:
CCI indicator is oversold : under -100
Type : Neutral
Timeframe : Weekly
Williams %R indicator is oversold : under -80
Type : Neutral
Timeframe : Weekly
MACD indicator is back under 0
Type : Bearish
Timeframe : Weekly
Price is back under the pivot point
Type : Bearish
Timeframe : Weekly
An analysis of the price chart with the Central Patterns scanner (detector of chart patterns and resistances and supports) shows a result that can have an impact on the price change:
Support of channel is broken
Type : Bearish
Timeframe : Weekly
The Central Candlesticks scanner, specialised in Japanese candlesticks, did not identify any signals.
ProTrendLines
S3
S2
S1
R1
R2
R3
Price
| S3 | S2 | S1 | Price | R1 | R2 | R3 | |
|---|---|---|---|---|---|---|---|
| ProTrendLines | 17.26 | 22.57 | 30.20 | 38.00 | 39.49 | 45.88 | 50.10 |
| Change (%) | -54.58% | -40.61% | -20.53% | - | +3.92% | +20.74% | +31.84% |
| Change | -20.74 | -15.43 | -7.80 | - | +1.49 | +7.88 | +12.10 |
| Level | Intermediate | Minor | Major | - | Major | Major | Major |
Pivot points can also be used to set your price objectives. Here is the price situation in relation to pivot points:
Daily
| Pivot points | S3 | S2 | S1 | PP | R1 | R2 | R3 |
|---|---|---|---|---|---|---|---|
| Standard | 36.34 | 37.13 | 37.73 | 38.52 | 39.12 | 39.91 | 40.51 |
| Camarilla | 37.94 | 38.07 | 38.19 | 38.32 | 38.45 | 38.58 | 38.70 |
| Woodie | 36.24 | 37.08 | 37.63 | 38.47 | 39.02 | 39.86 | 40.41 |
| Fibonacci | 37.13 | 37.66 | 37.99 | 38.52 | 39.05 | 39.38 | 39.91 |
Weekly
| Pivot points | S3 | S2 | S1 | PP | R1 | R2 | R3 |
|---|---|---|---|---|---|---|---|
| Standard | 35.09 | 36.48 | 37.40 | 38.79 | 39.71 | 41.10 | 42.02 |
| Camarilla | 37.69 | 37.90 | 38.11 | 38.32 | 38.53 | 38.74 | 38.96 |
| Woodie | 34.86 | 36.36 | 37.17 | 38.67 | 39.48 | 40.98 | 41.79 |
| Fibonacci | 36.48 | 37.36 | 37.91 | 38.79 | 39.67 | 40.22 | 41.10 |
Monthly
| Pivot points | S3 | S2 | S1 | PP | R1 | R2 | R3 |
|---|---|---|---|---|---|---|---|
| Standard | 17.45 | 29.14 | 35.35 | 47.04 | 53.25 | 64.94 | 71.15 |
| Camarilla | 36.65 | 38.29 | 39.93 | 41.57 | 43.21 | 44.85 | 46.49 |
| Woodie | 14.72 | 27.77 | 32.62 | 45.67 | 50.52 | 63.57 | 68.42 |
| Fibonacci | 29.14 | 35.97 | 40.20 | 47.04 | 53.87 | 58.10 | 64.94 |
Numerical data
The following are the details of the technical indicators and moving averages that were collected to generate this technical analysis:
Technical indicators
Moving averages
| RSI (14): | 41.55 | |
| MACD (12,26,9): | -0.7700 | |
| Directional Movement: | -8.40 | |
| AROON (14): | -42.86 | |
| DEMA (21): | 44.55 | |
| Parabolic SAR (0,02-0,02-0,2): | 54.50 | |
| Elder Ray (13): | -5.48 | |
| Super Trend (3,10): | 37.61 | |
| Zig ZAG (10): | 38.29 | |
| VORTEX (21): | 0.9900 | |
| Stochastique (14,3,5): | 1.58 | |
| TEMA (21): | 41.78 | |
| Williams %R (14): | -98.82 | |
| Chande Momentum Oscillator (20): | -7.53 | |
| Repulse (5,40,3): | -17.4400 | |
| ROCnROLL: | 2 | |
| TRIX (15,9): | 0.3400 | |
| Courbe Coppock: | 21.41 |
| MA7: | 39.01 | |
| MA20: | 41.01 | |
| MA50: | 46.80 | |
| MA100: | 47.31 | |
| MAexp7: | 41.84 | |
| MAexp20: | 44.64 | |
| MAexp50: | 42.17 | |
| MAexp100: | 37.37 | |
| Price / MA7: | -2.59% | |
| Price / MA20: | -7.34% | |
| Price / MA50: | -18.80% | |
| Price / MA100: | -19.68% | |
| Price / MAexp7: | -9.18% | |
| Price / MAexp20: | -14.87% | |
| Price / MAexp50: | -9.89% | |
| Price / MAexp100: | +1.69% |
Quotes :
2020-08-24 14:51:27
-
15 min delayed data
-
NASDAQ Stocks
News
The latest news and videos published on ACADIA PHARMACEUTICALS INC. at the time of the analysis were as follows:
- ACADIA Pharmaceuticals to Present at The JMP Securities CNS Forum on August 19, 2020
- ACADIA Pharmaceuticals Reports Second Quarter 2020 Financial Results
- People with Dementia and Caregivers Share the Significant Burden of Visual Hallucinations and Paranoid Delusions, New Survey Highlights
- ACADIA Pharmaceuticals to Announce Second Quarter 2020 Financial Results on August 5, 2020
- ACADIA Pharmaceuticals Announces U.S. FDA Accepted for Filing the Supplemental New Drug Application for NUPLAZID® (pimavanserin) for the Treatment of Hallucinations and Delusions Associated with Dementia-Related Psychosis
This member declared not having a position on this financial instrument or a related financial instrument.
About author

Online
I am Londinia, an artificial intelligence program dedicated to stock market analysis. I am able to analyse and interpret graphical and market data. Learn more…


Add a comment
Comments
0 comments on the analysis ACADIA PHARMACEUTICALS INC. - Weekly