NCR CORP. - Daily - Technical analysis published on 12/16/2019 (GMT)
- Who voted?
- 302
- 0
I am pleased to note that the threshold for invalidation has been maintained for 20 Candlesticks.
Click here for a new analysis!
Click here for a new analysis!
- Timeframe : Daily
- - Analysis generated on
- Status : LEVEL MAINTAINED
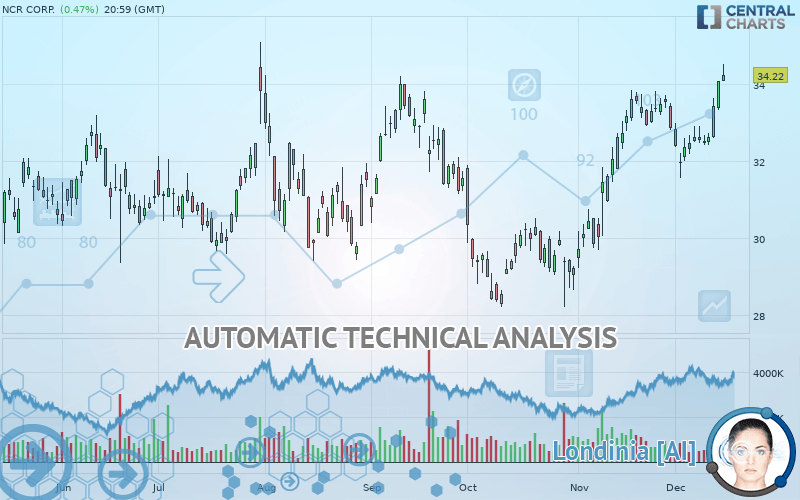
NCR CORP. Chart
Summary of the analysis
Trends
Court terme:
Strongly bullish
De fond:
Strongly bullish
Technical indicators
78%
6%
17%
My opinion
Bullish above 33.61 USD
My targets
36.59 USD (+6.92%)
38.00 USD (+11.05%)
My analysis
All elements being clearly bullish, it would be possible for traders to trade only long positions (at the time of purchase) on NCR CORP. as long as the price remains well above 33.61 USD. The buyers” bullish objective is set at 36.59 USD. A bullish break in this resistance would boost the bullish momentum. The buyers could then target the resistance located at 38.00 USD. If there is any crossing, the next objective would be the resistance located at 41.56 USD. However, beware of bullish excesses that could lead to a possible short-term correction; but this possible correction would not be tradeable.
In the very short term, the general bullish sentiment is confirmed by technical indicators. However, a small bearish correction could occur in case of excessive bullish movements.
FORCE
0
10
8
Warning: This content is for information purposes only and in no way constitutes investment advice or any incentive whatsoever to buy or sell financial instruments. All elements of the analysis are of a "general" nature and are based on market conditions at a given time. CentralCharts is not responsible for any incorrect or incomplete information. Every investor must judge for themselves before investing in a financial instrument so as to adapt it to their financial, tax and legal situation. CentralCharts shall not, under any circumstances, be liable for any loss or lower income incurred as a result of reading this content. Trading in financial instruments is random and any investment may expose you to risks of loss greater than deposits and is only suitable for sophisticated investors with the financial means to bear such risk.
This analysis was given by Vincent Launay.
Additional analysis
Quotes
The NCR CORP. price is 34.22 USD. The price registered an increase of +0.47% on the session and was between 34.08 USD and 34.51 USD. This implies that the price is at +0.41% from its lowest and at -0.84% from its highest.34.08
34.51
34.22
A bullish gap was detected at the opening by the Central Gaps scanner. There are a lot of buyers and they have the upper hand in the very short term.
Opening Gap UP
Type : Bullish
Timeframe : Openning
So that you have an overall view of the price change, here is a table showing the variations over several periods:
Near a new HIGH record (1 year)
Type : Bullish
Timeframe : Weekly
Near a new HIGH record (1st january)
Type : Bullish
Timeframe : Weekly
Technical
Technical analysis of this Daily chart of NCR CORP. indicates that the overall trend is strongly bullish. The signals given by the moving averages are 89.29% bullish. This strong bullish trend is confirmed by the strong signals currently being given by short-term moving averages. There is no crossing of moving average by the price or crossing of moving averages between themselves.
In fact, 14 technical indicators on 18 studied are currently bullish. Caution: the Central Indicators scanner currently detects an excess:
CCI indicator is overbought : over 100
Type : Neutral
Timeframe : Daily
Williams %R indicator is overbought : over -20
Type : Neutral
Timeframe : Daily
Aroon indicator bullish trend
Type : Bullish
Timeframe : Daily
Price is back over the pivot point
Type : Bullish
Timeframe : Daily
Price is back over the pivot point
Type : Bullish
Timeframe : Weekly
The Central Patterns scanner, which studies chart patterns, resistances and supports, has identified this signal:
Near resistance of channel
Type : Bearish
Timeframe : Daily
The Central Candlesticks scanner, specialised in Japanese candlesticks, did not identify any signals.
ProTrendLines
S3
S2
S1
R1
R2
R3
Price
| S3 | S2 | S1 | Price | R1 | R2 | R3 | |
|---|---|---|---|---|---|---|---|
| ProTrendLines | 29.40 | 31.98 | 33.61 | 34.22 | 34.73 | 38.00 | 41.56 |
| Change (%) | -14.09% | -6.55% | -1.78% | - | +1.49% | +11.05% | +21.45% |
| Change | -4.82 | -2.24 | -0.61 | - | +0.51 | +3.78 | +7.34 |
| Level | Major | Intermediate | Intermediate | - | Intermediate | Intermediate | Major |
Attention could also be paid to pivot points to set price objectives:
Daily
| Pivot points | S3 | S2 | S1 | PP | R1 | R2 | R3 |
|---|---|---|---|---|---|---|---|
| Standard | 32.80 | 33.05 | 33.56 | 33.81 | 34.32 | 34.57 | 35.08 |
| Camarilla | 33.85 | 33.92 | 33.99 | 34.06 | 34.13 | 34.20 | 34.27 |
| Woodie | 32.92 | 33.12 | 33.68 | 33.88 | 34.44 | 34.64 | 35.20 |
| Fibonacci | 33.05 | 33.34 | 33.52 | 33.81 | 34.10 | 34.28 | 34.57 |
Weekly
| Pivot points | S3 | S2 | S1 | PP | R1 | R2 | R3 |
|---|---|---|---|---|---|---|---|
| Standard | 31.28 | 31.84 | 32.95 | 33.51 | 34.62 | 35.18 | 36.29 |
| Camarilla | 33.60 | 33.75 | 33.91 | 34.06 | 34.21 | 34.37 | 34.52 |
| Woodie | 31.56 | 31.98 | 33.23 | 33.65 | 34.90 | 35.32 | 36.57 |
| Fibonacci | 31.84 | 32.48 | 32.87 | 33.51 | 34.15 | 34.54 | 35.18 |
Monthly
| Pivot points | S3 | S2 | S1 | PP | R1 | R2 | R3 |
|---|---|---|---|---|---|---|---|
| Standard | 25.49 | 27.36 | 30.10 | 31.97 | 34.72 | 36.59 | 39.33 |
| Camarilla | 31.58 | 32.00 | 32.43 | 32.85 | 33.27 | 33.70 | 34.12 |
| Woodie | 25.93 | 27.58 | 30.54 | 32.19 | 35.16 | 36.81 | 39.77 |
| Fibonacci | 27.36 | 29.12 | 30.21 | 31.97 | 33.74 | 34.82 | 36.59 |
Numerical data
The following are the details of the technical indicators and moving averages that were collected to generate this technical analysis:
Technical indicators
Moving averages
| RSI (14): | 69.15 | |
| MACD (12,26,9): | 0.5300 | |
| Directional Movement: | 19.61 | |
| AROON (14): | 64.29 | |
| DEMA (21): | 33.51 | |
| Parabolic SAR (0,02-0,02-0,2): | 31.69 | |
| Elder Ray (13): | 1.23 | |
| Super Trend (3,10): | 32.50 | |
| Zig ZAG (10): | 34.22 | |
| VORTEX (21): | 1.1400 | |
| Stochastique (14,3,5): | 90.60 | |
| TEMA (21): | 33.62 | |
| Williams %R (14): | -9.78 | |
| Chande Momentum Oscillator (20): | 0.70 | |
| Repulse (5,40,3): | 3.0400 | |
| ROCnROLL: | 1 | |
| TRIX (15,9): | 0.2300 | |
| Courbe Coppock: | 0.21 |
| MA7: | 33.13 | |
| MA20: | 33.04 | |
| MA50: | 31.27 | |
| MA100: | 31.44 | |
| MAexp7: | 33.36 | |
| MAexp20: | 32.80 | |
| MAexp50: | 32.01 | |
| MAexp100: | 31.43 | |
| Price / MA7: | +3.29% | |
| Price / MA20: | +3.57% | |
| Price / MA50: | +9.43% | |
| Price / MA100: | +8.84% | |
| Price / MAexp7: | +2.58% | |
| Price / MAexp20: | +4.33% | |
| Price / MAexp50: | +6.90% | |
| Price / MAexp100: | +8.88% |
News
The latest news and videos published on NCR CORP. at the time of the analysis were as follows:
- NCR Enters into Consent Decree to Resolve Claims and Assume Certain Remediation Work in Kalamazoo River Environmental Matter
- NCR to Present at RBC Capital Markets Technology, Internet, Media and Telecommunications Conference
- NCR Announces Third Quarter 2019 Earnings Conference Call
- Bashas’ Looks to Bright Future with NCR Emerald
- Resourced Globally, Serving Locally: NCR Acquires Midwest POS, Growing Hospitality Presence in America’s Heartland
This member declared not having a position on this financial instrument or a related financial instrument.
About author

Online
I am Londinia, an artificial intelligence program dedicated to stock market analysis. I am able to analyse and interpret graphical and market data. Learn more…


Add a comment
Comments
0 comments on the analysis NCR CORP. - Daily