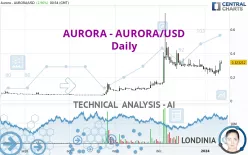
AURORA - AURORA/USD - Daily - Technical analysis published on 01/12/2024 (GMT)
- 265
- 0
Click here for a new analysis!
- Timeframe : Daily
- - Analysis generated on
- Status : INVALID

Summary of the analysis

Additional analysis
Quotes
AURORA - AURORA/USD rating 0.323212 USD. The price has increased by +2.96% since the last closing with the lowest point at 0.313876 USD and the highest point at 0.338878 USD. The deviation from the price is +2.97% for the low point and -4.62% for the high point.The Central Gaps scanner detects a bearish opening. A small advantage for sellers in the very short term.
Bearish opening
Type : Bearish
Timeframe : Openning
So that you have an overall view of the price change, here is a table showing the variations over several periods:
Near a new HIGH record (1st january)
Type : Bullish
Timeframe : Weekly
The Central Volumes scanner detects abnormal volumes on the asset:
Abnormal volumes
Timeframe : 50 days
Technical
Technical analysis of AURORA - AURORA/USD in Daily shows a strongly overall bullish trend. 92.86% of the signals given by moving averages are bullish. The overall trend is supported by the strong bullish signals from short-term moving averages. An assessment of moving averages reveals several bearish and bullish signals:
Bullish trend reversal : Moving Average 20
Type : Bullish
Timeframe : Daily
Bullish trend reversal : adaptative moving average 20
Type : Bullish
Timeframe : Daily
Moving Average bearish crossovers : AMA20 & AMA50
Type : Bearish
Timeframe : Daily
In fact, 15 technical indicators on 18 studied are currently positioned bullish. Caution: the Central Indicators scanner currently detects an excess:
CCI indicator is overbought : over 100
Type : Neutral
Timeframe : Daily
Williams %R indicator is overbought : over -20
Type : Neutral
Timeframe : Daily
Pivot points : price is over resistance 3
Type : Neutral
Timeframe : Weekly
MACD crosses UP its Moving Average
Type : Bullish
Timeframe : Daily
Aroon indicator bullish trend
Type : Bullish
Timeframe : Daily
MACD indicator is back over 0
Type : Bullish
Timeframe : Daily
The analysis of the price chart with Central Patterns scanners does not return any result.
The Central Candlesticks scanner, specialised in Japanese candlesticks, did not identify any signals.
| S3 | S2 | S1 | Price | R1 | R2 | |
|---|---|---|---|---|---|---|
| ProTrendLines | 0.084470 | 0.138994 | 0.293655 | 0.323212 | 0.399836 | 0.447204 |
| Change (%) | -73.87% | -57.00% | -9.14% | - | +23.71% | +38.36% |
| Change | -0.238742 | -0.184218 | -0.029557 | - | +0.076624 | +0.123992 |
| Level | Intermediate | Minor | Major | - | Minor | Intermediate |
To determine price objectives, it is also possible to use the pivot points. Here is the price position in relation to pivot points:
| Pivot points | S3 | S2 | S1 | PP | R1 | R2 | R3 |
|---|---|---|---|---|---|---|---|
| Standard | 0.171304 | 0.210163 | 0.262043 | 0.300902 | 0.352782 | 0.391641 | 0.443521 |
| Camarilla | 0.288971 | 0.297289 | 0.305606 | 0.313924 | 0.322242 | 0.330560 | 0.338877 |
| Woodie | 0.177816 | 0.213418 | 0.268555 | 0.304157 | 0.359294 | 0.394896 | 0.450033 |
| Fibonacci | 0.210163 | 0.244825 | 0.266239 | 0.300902 | 0.335564 | 0.356978 | 0.391641 |
| Pivot points | S3 | S2 | S1 | PP | R1 | R2 | R3 |
|---|---|---|---|---|---|---|---|
| Standard | 0.150791 | 0.188379 | 0.217248 | 0.254836 | 0.283705 | 0.321293 | 0.350162 |
| Camarilla | 0.227840 | 0.233932 | 0.240024 | 0.246116 | 0.252208 | 0.258300 | 0.264392 |
| Woodie | 0.146431 | 0.186199 | 0.212888 | 0.252656 | 0.279345 | 0.319113 | 0.345802 |
| Fibonacci | 0.188379 | 0.213766 | 0.229450 | 0.254836 | 0.280223 | 0.295907 | 0.321293 |
| Pivot points | S3 | S2 | S1 | PP | R1 | R2 | R3 |
|---|---|---|---|---|---|---|---|
| Standard | -0.586086 | -0.226545 | 0.020185 | 0.379726 | 0.626456 | 0.985997 | 1.232727 |
| Camarilla | 0.100192 | 0.155766 | 0.211341 | 0.266916 | 0.322491 | 0.378066 | 0.433641 |
| Woodie | -0.642491 | -0.254748 | -0.036220 | 0.351523 | 0.570052 | 0.957794 | 1.176323 |
| Fibonacci | -0.226545 | 0.005050 | 0.148130 | 0.379726 | 0.611321 | 0.754401 | 0.985997 |
Numerical data
The following is the status of the technical indicators and moving averages at the time of publication of this technical analysis:
| RSI (14): | 61.95 | |
| MACD (12,26,9): | 0.0027 | |
| Directional Movement: | 23.061781 | |
| AROON (14): | 21.428572 | |
| DEMA (21): | 0.281558 | |
| Parabolic SAR (0,02-0,02-0,2): | 0.216846 | |
| Elder Ray (13): | 0.048458 | |
| Super Trend (3,10): | 0.343235 | |
| Zig ZAG (10): | 0.333871 | |
| VORTEX (21): | 1.0236 | |
| Stochastique (14,3,5): | 69.28 | |
| TEMA (21): | 0.269285 | |
| Williams %R (14): | -6.74 | |
| Chande Momentum Oscillator (20): | 0.066931 | |
| Repulse (5,40,3): | 20.0207 | |
| ROCnROLL: | 1 | |
| TRIX (15,9): | -0.1281 | |
| Courbe Coppock: | 11.21 |
| MA7: | 0.267833 | |
| MA20: | 0.276798 | |
| MA50: | 0.270550 | |
| MA100: | 0.174175 | |
| MAexp7: | 0.284414 | |
| MAexp20: | 0.277292 | |
| MAexp50: | 0.252589 | |
| MAexp100: | 0.203472 | |
| Price / MA7: | +20.68% | |
| Price / MA20: | +16.77% | |
| Price / MA50: | +19.46% | |
| Price / MA100: | +85.57% | |
| Price / MAexp7: | +13.64% | |
| Price / MAexp20: | +16.56% | |
| Price / MAexp50: | +27.96% | |
| Price / MAexp100: | +58.85% |
About author

Online


Add a comment
Comments
0 comments on the analysis AURORA - AURORA/USD - Daily