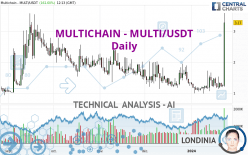
MULTICHAIN - MULTI/USDT - Daily - Technical analysis published on 01/23/2024 (GMT)
- 88
- 0
- Timeframe : Daily
- - Analysis generated on
- Status : WITHOUT TARGET

Summary of the analysis

Additional analysis
Quotes
The MULTICHAIN - MULTI/USDT price is 3.27 USDT. On the day, this instrument gained +161.60% with the lowest point at 1.20 USDT and the highest point at 3.58 USDT. The deviation from the price is +172.50% for the low point and -8.66% for the high point.The Central Gaps scanner detects a bearish opening. A small advantage for sellers in the very short term.
Bearish opening
Type : Bearish
Timeframe : Openning
Here is a more detailed summary of the historical variations registered by MULTICHAIN - MULTI/USDT:
New HIGH record (1st january)
Type : Bullish
Timeframe : Weekly
New HIGH record (1 month)
Type : Bullish
Timeframe : Weekly
The Central Volumes scanner detects abnormal volumes on the asset:
Abnormal volumes
Timeframe : 5 days
Abnormal volumes
Timeframe : 20 days
Technical
Technical analysis of MULTICHAIN - MULTI/USDT in Daily shows an overall bullish trend. The signals returned by the moving averages are 75.00% bullish. This bullish trend is reinforced by the strong signals currently being given by short-term moving averages. The Central Indicators scanner detects bullish signals on moving averages that could impact this trend:
Bullish trend reversal : Moving Average 20
Type : Bullish
Timeframe : Daily
Bullish price crossover with Moving Average 50
Type : Bullish
Timeframe : Daily
Bullish price crossover with Moving Average 100
Type : Bullish
Timeframe : Daily
Bullish price crossover with adaptative moving average 20
Type : Bullish
Timeframe : Daily
Bullish price crossover with adaptative moving average 50
Type : Bullish
Timeframe : Daily
Bullish price crossover with adaptative moving average 100
Type : Bullish
Timeframe : Daily
The probability of a further increase is high given the direction of the technical indicators.
But beware of excesses. The Central Indicators scanner currently detects this:
RSI indicator is overbought : over 80
Type : Neutral
Timeframe : Daily
CCI indicator is overbought : over 100
Type : Neutral
Timeframe : Daily
Pivot points : price is over resistance 3
Type : Neutral
Timeframe : Daily
Pivot points : price is over resistance 3
Type : Neutral
Timeframe : Weekly
Ichimoku : price is over the cloud
Type : Bullish
Timeframe : Daily
SuperTrend indicator bullish reversal
Type : Bullish
Timeframe : Daily
MACD indicator is back over 0
Type : Bullish
Timeframe : Daily
Ichimoku - Bullish crossover : Tenkan & Kijun
Type : Bullish
Timeframe : Daily
Williams %R indicator is back over -50
Type : Bullish
Timeframe : Daily
Central Patterns, the market scanner focusing on chart patterns, resistances and supports found these results:
Horizontal resistance is broken
Type : Bullish
Timeframe : Daily
Resistance of channel is broken
Type : Bullish
Timeframe : Daily
The presence of a bullish Japanese candlestick pattern detected by Central Candlesticks that could cause a very short term rebound was also detected:
Long white line
Type : Bullish
Timeframe : Daily
| S3 | S2 | S1 | Price | |
|---|---|---|---|---|
| ProTrendLines | 1.90 | 2.38 | 3.13 | 3.27 |
| Change (%) | -41.90% | -27.22% | -4.28% | - |
| Change | -1.37 | -0.89 | -0.14 | - |
| Level | Minor | Minor | Intermediate | - |
Attention could also be paid to pivot points to set price objectives:
| Pivot points | S3 | S2 | S1 | PP | R1 | R2 | R3 |
|---|---|---|---|---|---|---|---|
| Standard | 1.11 | 1.15 | 1.20 | 1.24 | 1.29 | 1.33 | 1.38 |
| Camarilla | 1.23 | 1.23 | 1.24 | 1.25 | 1.26 | 1.27 | 1.28 |
| Woodie | 1.12 | 1.15 | 1.21 | 1.24 | 1.30 | 1.33 | 1.39 |
| Fibonacci | 1.15 | 1.18 | 1.21 | 1.24 | 1.27 | 1.30 | 1.33 |
| Pivot points | S3 | S2 | S1 | PP | R1 | R2 | R3 |
|---|---|---|---|---|---|---|---|
| Standard | 0.55 | 0.84 | 1.08 | 1.37 | 1.61 | 1.90 | 2.14 |
| Camarilla | 1.17 | 1.22 | 1.27 | 1.32 | 1.37 | 1.42 | 1.47 |
| Woodie | 0.53 | 0.83 | 1.06 | 1.36 | 1.59 | 1.89 | 2.12 |
| Fibonacci | 0.84 | 1.04 | 1.17 | 1.37 | 1.57 | 1.70 | 1.90 |
| Pivot points | S3 | S2 | S1 | PP | R1 | R2 | R3 |
|---|---|---|---|---|---|---|---|
| Standard | 0.08 | 0.60 | 0.97 | 1.49 | 1.86 | 2.38 | 2.75 |
| Camarilla | 1.09 | 1.17 | 1.25 | 1.33 | 1.41 | 1.49 | 1.58 |
| Woodie | -0.01 | 0.56 | 0.89 | 1.45 | 1.78 | 2.34 | 2.67 |
| Fibonacci | 0.60 | 0.94 | 1.15 | 1.49 | 1.83 | 2.04 | 2.38 |
Numerical data
The following is the status of technical indicators and moving averages registered at the time this technical analysis was created:
| RSI (14): | 80.13 | |
| MACD (12,26,9): | 0.1300 | |
| Directional Movement: | 50.30 | |
| AROON (14): | 100.00 | |
| DEMA (21): | 1.58 | |
| Parabolic SAR (0,02-0,02-0,2): | 1.13 | |
| Elder Ray (13): | 1.01 | |
| Super Trend (3,10): | 1.15 | |
| Zig ZAG (10): | 3.27 | |
| VORTEX (21): | 1.0100 | |
| Stochastique (14,3,5): | 48.83 | |
| TEMA (21): | 1.76 | |
| Williams %R (14): | -22.69 | |
| Chande Momentum Oscillator (20): | 2.10 | |
| Repulse (5,40,3): | 65.5600 | |
| ROCnROLL: | 1 | |
| TRIX (15,9): | -0.0600 | |
| Courbe Coppock: | 79.21 |
| MA7: | 1.54 | |
| MA20: | 1.34 | |
| MA50: | 1.40 | |
| MA100: | 1.61 | |
| MAexp7: | 1.76 | |
| MAexp20: | 1.47 | |
| MAexp50: | 1.46 | |
| MAexp100: | 1.64 | |
| Price / MA7: | +112.34% | |
| Price / MA20: | +144.03% | |
| Price / MA50: | +133.57% | |
| Price / MA100: | +103.11% | |
| Price / MAexp7: | +85.80% | |
| Price / MAexp20: | +122.45% | |
| Price / MAexp50: | +123.97% | |
| Price / MAexp100: | +99.39% |
About author

Online


Add a comment
Comments
0 comments on the analysis MULTICHAIN - MULTI/USDT - Daily