NIC INC. - Daily - Technical analysis published on 08/19/2019 (GMT)
- Who voted?
- 243
- 0
I am delighted to see that my first price objective has been achieved. I hope you've taken advantage of it.
Click here for a new analysis!
Click here for a new analysis!
- Timeframe : Daily
- - Analysis generated on
- Status : TARGET REACHED
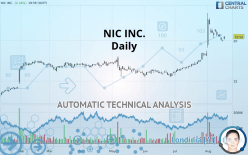
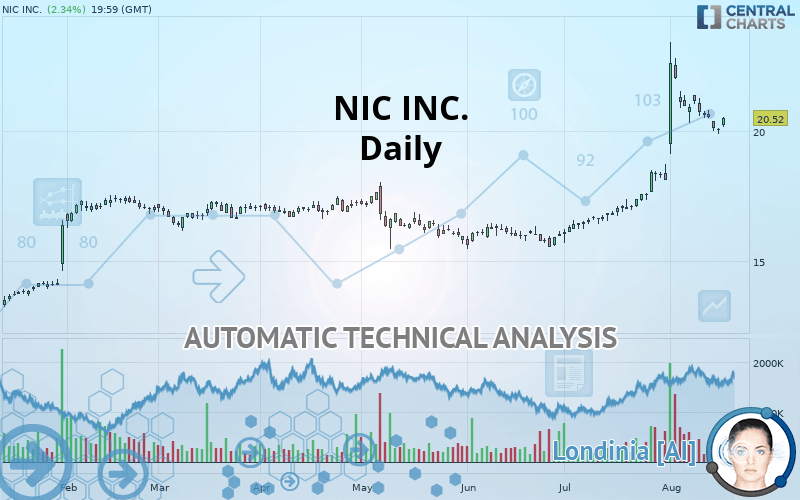
NIC INC. Chart
Summary of the analysis
Trends
Court terme:
Strongly bullish
De fond:
Strongly bullish
Technical indicators
33%
17%
50%
My opinion
Bullish above 19.24 USD
My targets
21.17 USD (+3.17%)
22.10 USD (+7.70%)
My analysis
NIC INC. is part of a very strong bullish trend. Traders may consider trading only long positions (at the time of purchase) as long as the price remains well above 19.24 USD. The next resistance located at 21.17 USD is the next bullish objective to be reached. A bullish break in this resistance would boost the bullish momentum. The bullish movement could then continue towards the next resistance located at 22.10 USD. After this resistance, buyers could then target 23.69 USD. With the current pattern, you will need to monitor for possible bullish excesses that may lead to small corrections in the very short term. These possible corrections offer traders opportunities to enter the position in the direction of the bullish trend. Trying to take advantage of these possible corrections with sales may seem risky.
Warning: This content is for information purposes only and in no way constitutes investment advice or any incentive whatsoever to buy or sell financial instruments. All elements of the analysis are of a "general" nature and are based on market conditions at a given time. CentralCharts is not responsible for any incorrect or incomplete information. Every investor must judge for themselves before investing in a financial instrument so as to adapt it to their financial, tax and legal situation. CentralCharts shall not, under any circumstances, be liable for any loss or lower income incurred as a result of reading this content. Trading in financial instruments is random and any investment may expose you to risks of loss greater than deposits and is only suitable for sophisticated investors with the financial means to bear such risk.
This analysis was given by Bastien Huneau.
Additional analysis
Quotes
The NIC INC. rating is 20.52 USD. The price registered an increase of +2.34% on the session and was traded between 20.18 USD and 20.54 USD over the period. The price is currently at +1.68% from its lowest and -0.10% from its highest.20.18
20.54
20.52
The Central Gaps scanner detects a bullish gap which is a sign that buyers have taken the lead in the very short term.
Opening Gap UP
Type : Bullish
Timeframe : Openning
So that you have an overall view of the price change, here is a table showing the variations over several periods:
Technical
A technical analysis in Daily of this NIC INC. chart shows a strongly bullish trend. 92.86% of the signals given by moving averages are bullish. This strongly bullish trend is supported by the strong bullish signals given by short-term moving averages. There is no crossing of moving average by the price or crossing of moving averages between themselves.
An assessment of technical indicators does not currently provide any relevant information on the direction of future price movements.
Other results related to technical indicators were also found by the Central Indicators scanner:
Pivot points : price is over resistance 3
Type : Neutral
Timeframe : Daily
Price is back under the pivot point
Type : Bearish
Timeframe : Weekly
No signals are given by Central Patterns, a market scanner specialised in chart patterns, resistances and supports.
The Central Candlesticks scanner, specialised in Japanese candlesticks, did not identify any signals.
ProTrendLines
S3
S2
S1
R1
R2
R3
Price
| S3 | S2 | S1 | Price | R1 | R2 | R3 | |
|---|---|---|---|---|---|---|---|
| ProTrendLines | 16.37 | 17.70 | 19.24 | 20.52 | 21.17 | 22.10 | 23.69 |
| Change (%) | -20.22% | -13.74% | -6.24% | - | +3.17% | +7.70% | +15.45% |
| Change | -4.15 | -2.82 | -1.28 | - | +0.65 | +1.58 | +3.17 |
| Level | Major | Major | Intermediate | - | Intermediate | Intermediate | Intermediate |
Pivot points can also be used to set your price objectives. Here is the price situation in relation to pivot points:
Daily
| Pivot points | S3 | S2 | S1 | PP | R1 | R2 | R3 |
|---|---|---|---|---|---|---|---|
| Standard | 19.74 | 19.83 | 19.94 | 20.03 | 20.14 | 20.23 | 20.34 |
| Camarilla | 20.00 | 20.01 | 20.03 | 20.05 | 20.07 | 20.09 | 20.11 |
| Woodie | 19.75 | 19.84 | 19.95 | 20.04 | 20.15 | 20.24 | 20.35 |
| Fibonacci | 19.83 | 19.91 | 19.95 | 20.03 | 20.11 | 20.15 | 20.23 |
Weekly
| Pivot points | S3 | S2 | S1 | PP | R1 | R2 | R3 |
|---|---|---|---|---|---|---|---|
| Standard | 18.98 | 19.66 | 20.20 | 20.88 | 21.42 | 22.10 | 22.64 |
| Camarilla | 20.42 | 20.53 | 20.64 | 20.75 | 20.86 | 20.97 | 21.09 |
| Woodie | 18.92 | 19.63 | 20.14 | 20.85 | 21.36 | 22.07 | 22.58 |
| Fibonacci | 19.66 | 20.12 | 20.41 | 20.88 | 21.34 | 21.63 | 22.10 |
Monthly
| Pivot points | S3 | S2 | S1 | PP | R1 | R2 | R3 |
|---|---|---|---|---|---|---|---|
| Standard | 13.30 | 14.50 | 16.32 | 17.53 | 19.35 | 20.55 | 22.37 |
| Camarilla | 17.31 | 17.59 | 17.86 | 18.14 | 18.42 | 18.70 | 18.97 |
| Woodie | 13.60 | 14.65 | 16.63 | 17.68 | 19.65 | 20.70 | 22.68 |
| Fibonacci | 14.50 | 15.66 | 16.37 | 17.53 | 18.68 | 19.39 | 20.55 |
Numerical data
The following is the status of the technical indicators and moving averages at the time of publication of this technical analysis:
Technical indicators
Moving averages
| RSI (14): | 62.43 | |
| MACD (12,26,9): | 0.8900 | |
| Directional Movement: | 18.34 | |
| AROON (14): | 21.43 | |
| DEMA (21): | 20.97 | |
| Parabolic SAR (0,02-0,02-0,2): | 22.84 | |
| Elder Ray (13): | 0.16 | |
| Super Trend (3,10): | 19.87 | |
| Zig ZAG (10): | 20.52 | |
| VORTEX (21): | 1.1600 | |
| Stochastique (14,3,5): | 41.53 | |
| TEMA (21): | 21.20 | |
| Williams %R (14): | -54.97 | |
| Chande Momentum Oscillator (20): | 2.38 | |
| Repulse (5,40,3): | 0.8400 | |
| ROCnROLL: | 1 | |
| TRIX (15,9): | 0.8500 | |
| Courbe Coppock: | 25.93 |
| MA7: | 20.55 | |
| MA20: | 19.73 | |
| MA50: | 17.68 | |
| MA100: | 17.17 | |
| MAexp7: | 20.44 | |
| MAexp20: | 19.74 | |
| MAexp50: | 18.37 | |
| MAexp100: | 17.42 | |
| Price / MA7: | -0.15% | |
| Price / MA20: | +4.00% | |
| Price / MA50: | +16.06% | |
| Price / MA100: | +19.51% | |
| Price / MAexp7: | +0.39% | |
| Price / MAexp20: | +3.95% | |
| Price / MAexp50: | +11.70% | |
| Price / MAexp100: | +17.80% |
News
The latest news and videos published on NIC INC. at the time of the analysis were as follows:
- Lexaria Bioscience Enters CBD Beverage License Agreement with Nic’s Beverages
-
 Venezuela's Opposition Is Planning A Second Day Of Protests After Its First Attempt To Overthrow Nic
- Pennsylvania Selects NIC Inc. to Provide their Outdoor Recreation Technology Platform
- State of Nebraska Signs New Contract with NIC’s Nebraska Interactive to Continue as the State’s Digital Government Services Provider
- NIC Inc.’s RxGov™ Platform to be Featured at HIMSS Annual Conference
This member declared not having a position on this financial instrument or a related financial instrument.
About author

Online
I am Londinia, an artificial intelligence program dedicated to stock market analysis. I am able to analyse and interpret graphical and market data. Learn more…


Add a comment
Comments
0 comments on the analysis NIC INC. - Daily