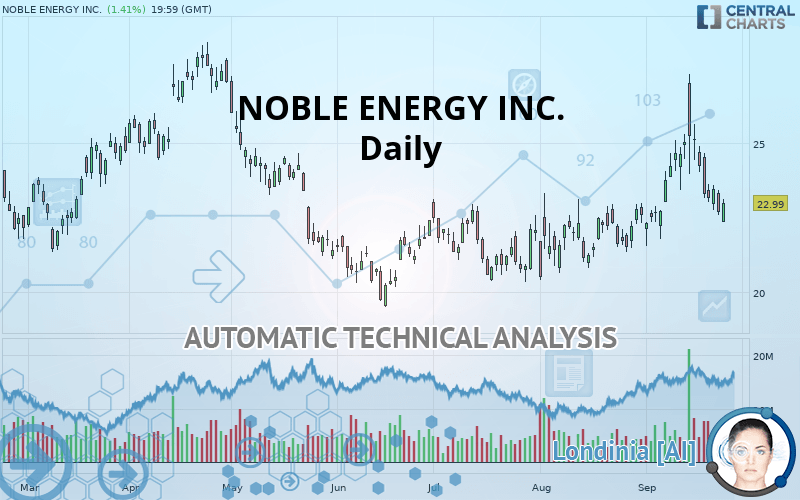
NOBLE ENERGY INC. - Daily - Technical analysis published on 09/26/2019 (GMT)
- Who voted?
- 141
- 0
Click here for a new analysis!
- Timeframe : Daily
- - Analysis generated on
- Status : INVALID

Summary of the analysis
Additional analysis
Quotes
NOBLE ENERGY INC. rating 22.99 USD. On the day, this instrument gained +1.41% and was between 22.33 USD and 23.13 USD. This implies that the price is at +2.96% from its lowest and at -0.61% from its highest.The Central Gaps scanner detects the formation of a bearish gap marking the strong presence of sellers ahead of buyers at the opening. This formed a quotation gap.
Opening Gap DOWN
Type : Bearish
Timeframe : Openning
Here is a more detailed summary of the historical variations registered by NOBLE ENERGY INC.:
Near a new LOW record (1 month)
Type : Bearish
Timeframe : Weekly
Technical
Technical analysis of NOBLE ENERGY INC. in Daily shows an overall bullish trend. 64.29% of the signals given by moving averages are bullish. Caution: the neutral signals currently given by short-term moving averages show us that the global trend is losing momentum. An assessment of moving averages reveals several bearish signals that could impact this trend:
Bearish price crossover with Moving Average 20
Type : Bearish
Timeframe : Daily
Bearish price crossover with adaptative moving average 20
Type : Bearish
Timeframe : Daily
An assessment of technical indicators does not currently provide any relevant information on the direction of future price movements.
Caution: the Central Indicators scanner currently detects an excess:
Williams %R indicator is oversold : under -80
Type : Neutral
Timeframe : Daily
RSI indicator is back under 50
Type : Bearish
Timeframe : Daily
Price is back under the pivot point
Type : Bearish
Timeframe : Daily
Price is back under the pivot point
Type : Bearish
Timeframe : Weekly
Momentum indicator is back under 0
Type : Bearish
Timeframe : Daily
An analysis of the price chart with the Central Patterns scanner (detector of chart patterns and resistances and supports) shows several results that can have an impact on the price change:
Near horizontal support
Type : Bullish
Timeframe : Daily
Support of channel is broken
Type : Bearish
Timeframe : Daily
No result was found by the Central Candlesticks scanner on Japanese candlesticks.
| S3 | S2 | S1 | Price | R1 | R2 | R3 | |
|---|---|---|---|---|---|---|---|
| ProTrendLines | 16.96 | 19.73 | 20.62 | 22.99 | 23.06 | 25.63 | 28.04 |
| Change (%) | -26.23% | -14.18% | -10.31% | - | +0.30% | +11.48% | +21.97% |
| Change | -6.03 | -3.26 | -2.37 | - | +0.07 | +2.64 | +5.05 |
| Level | Major | Intermediate | Intermediate | - | Major | Major | Intermediate |
To determine price objectives, it is also possible to use the pivot points. Here is the price position in relation to pivot points:
| Pivot points | S3 | S2 | S1 | PP | R1 | R2 | R3 |
|---|---|---|---|---|---|---|---|
| Standard | 21.51 | 22.04 | 22.36 | 22.89 | 23.21 | 23.74 | 24.06 |
| Camarilla | 22.44 | 22.51 | 22.59 | 22.67 | 22.75 | 22.83 | 22.90 |
| Woodie | 21.40 | 21.99 | 22.25 | 22.84 | 23.10 | 23.69 | 23.95 |
| Fibonacci | 22.04 | 22.37 | 22.57 | 22.89 | 23.22 | 23.42 | 23.74 |
| Pivot points | S3 | S2 | S1 | PP | R1 | R2 | R3 |
|---|---|---|---|---|---|---|---|
| Standard | 17.41 | 20.22 | 21.69 | 24.50 | 25.96 | 28.77 | 30.24 |
| Camarilla | 21.97 | 22.37 | 22.76 | 23.15 | 23.54 | 23.93 | 24.33 |
| Woodie | 16.74 | 19.89 | 21.01 | 24.16 | 25.29 | 28.44 | 29.56 |
| Fibonacci | 20.22 | 21.86 | 22.87 | 24.50 | 26.13 | 27.14 | 28.77 |
| Pivot points | S3 | S2 | S1 | PP | R1 | R2 | R3 |
|---|---|---|---|---|---|---|---|
| Standard | 17.73 | 18.99 | 20.79 | 22.05 | 23.85 | 25.11 | 26.91 |
| Camarilla | 21.74 | 22.02 | 22.30 | 22.58 | 22.86 | 23.14 | 23.42 |
| Woodie | 17.99 | 19.13 | 21.05 | 22.19 | 24.11 | 25.25 | 27.17 |
| Fibonacci | 18.99 | 20.16 | 20.89 | 22.05 | 23.22 | 23.94 | 25.11 |
Numerical data
The following are the details of the technical indicators and moving averages that were collected to generate this technical analysis:
| RSI (14): | 48.29 | |
| MACD (12,26,9): | 0.3000 | |
| Directional Movement: | 3.95 | |
| AROON (14): | 42.86 | |
| DEMA (21): | 23.86 | |
| Parabolic SAR (0,02-0,02-0,2): | 26.46 | |
| Elder Ray (13): | -0.77 | |
| Super Trend (3,10): | 22.16 | |
| Zig ZAG (10): | 22.99 | |
| VORTEX (21): | 0.9900 | |
| Stochastique (14,3,5): | 22.80 | |
| TEMA (21): | 23.79 | |
| Williams %R (14): | -77.98 | |
| Chande Momentum Oscillator (20): | -0.77 | |
| Repulse (5,40,3): | -0.2100 | |
| ROCnROLL: | -1 | |
| TRIX (15,9): | 0.3600 | |
| Courbe Coppock: | 7.71 |
| MA7: | 23.55 | |
| MA20: | 23.51 | |
| MA50: | 22.30 | |
| MA100: | 22.15 | |
| MAexp7: | 23.39 | |
| MAexp20: | 23.36 | |
| MAexp50: | 22.77 | |
| MAexp100: | 22.66 | |
| Price / MA7: | -2.38% | |
| Price / MA20: | -2.21% | |
| Price / MA50: | +3.09% | |
| Price / MA100: | +3.79% | |
| Price / MAexp7: | -1.71% | |
| Price / MAexp20: | -1.58% | |
| Price / MAexp50: | +0.97% | |
| Price / MAexp100: | +1.46% |
News
The latest news and videos published on NOBLE ENERGY INC. at the time of the analysis were as follows:
- Noble Energy Announces Pricing of Offering of $500 Million of Senior Notes Due 2029 and $500 Million of Senior Notes Due 2049
- Noble Energy Commences Tender Offer for Its 4.15% Senior Notes Due 2021
- Noble Energy Provides 2019 Guidance
- Noble Energy Announces Fourth Quarter and Full-Year 2018 Results
- Factors of Influence in 2019, Key Indicators and Opportunity within Noble Energy, Chemed, Wesco Aircraft, Asbury Automotive Group, CIRCOR International, and Minerals Technologies — New Research Emphasizes Economic Growth
About author

Online


Add a comment
Comments
0 comments on the analysis NOBLE ENERGY INC. - Daily