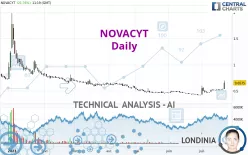
NOVACYT - Daily - Technical analysis published on 07/24/2023 (GMT)
- 223
- 0
Click here for a new analysis!
- Timeframe : Daily
- - Analysis generated on
- Status : TARGET REACHED

Summary of the analysis

Additional analysis
Quotes
NOVACYT rating 0.6575 EUR. The price has increased by +21.76% since the last closing and was between 0.5360 EUR and 0.6980 EUR. This implies that the price is at +22.67% from its lowest and at -5.80% from its highest.Here is a more detailed summary of the historical variations registered by NOVACYT:
New HIGH record (1 month)
Type : Bullish
Timeframe : Weekly
Technical
Technical analysis of NOVACYT in Daily shows an overall bullish trend. 67.86% of the signals given by moving averages are bullish. The overall trend is reinforced by the strong bullish signals from short-term moving averages. The Central Indicators scanner detects a bullish signal on moving averages that could impact this trend:
Bullish price crossover with Moving Average 100
Type : Bullish
Timeframe : Daily
In fact, 16 technical indicators on 18 studied are currently positioned bullish. Caution: the Central Indicators scanner currently detects an excess:
RSI indicator is overbought : over 70
Type : Neutral
Timeframe : Daily
CCI indicator is overbought : over 100
Type : Neutral
Timeframe : Daily
Williams %R indicator is overbought : over -20
Type : Neutral
Timeframe : Daily
Pivot points : price is over resistance 3
Type : Neutral
Timeframe : Daily
Pivot points : price is over resistance 3
Type : Neutral
Timeframe : Weekly
Ichimoku : price is over the cloud
Type : Bullish
Timeframe : Daily
The Central Patterns scanner, which studies chart patterns, resistances and supports, has identified this signal:
Horizontal resistance is broken
Type : Bullish
Timeframe : Daily
The presence of a bullish Japanese candlestick pattern detected by Central Candlesticks that could cause a very short term rebound was also detected:
Long white line
Type : Bullish
Timeframe : Daily
| S2 | S1 | Price | R1 | R2 | R3 | |
|---|---|---|---|---|---|---|
| ProTrendLines | 0.0629 | 0.5500 | 0.6575 | 0.7120 | 0.9563 | 1.7740 |
| Change (%) | -90.43% | -16.35% | - | +8.29% | +45.44% | +169.81% |
| Change | -0.5946 | -0.1075 | - | +0.0545 | +0.2988 | +1.1165 |
| Level | Major | Minor | - | Intermediate | Minor | Major |
To determine price objectives, it is also possible to use the pivot points. Here is the price position in relation to pivot points:
| Pivot points | S3 | S2 | S1 | PP | R1 | R2 | R3 |
|---|---|---|---|---|---|---|---|
| Standard | 0.5095 | 0.5170 | 0.5285 | 0.5360 | 0.5475 | 0.5550 | 0.5665 |
| Camarilla | 0.5348 | 0.5365 | 0.5383 | 0.5400 | 0.5417 | 0.5435 | 0.5452 |
| Woodie | 0.5115 | 0.5180 | 0.5305 | 0.5370 | 0.5495 | 0.5560 | 0.5685 |
| Fibonacci | 0.5170 | 0.5243 | 0.5287 | 0.5360 | 0.5433 | 0.5477 | 0.5550 |
| Pivot points | S3 | S2 | S1 | PP | R1 | R2 | R3 |
|---|---|---|---|---|---|---|---|
| Standard | 0.4862 | 0.4983 | 0.5192 | 0.5313 | 0.5522 | 0.5643 | 0.5852 |
| Camarilla | 0.5309 | 0.5340 | 0.5370 | 0.5400 | 0.5430 | 0.5461 | 0.5491 |
| Woodie | 0.4905 | 0.5005 | 0.5235 | 0.5335 | 0.5565 | 0.5665 | 0.5895 |
| Fibonacci | 0.4983 | 0.5109 | 0.5187 | 0.5313 | 0.5439 | 0.5517 | 0.5643 |
| Pivot points | S3 | S2 | S1 | PP | R1 | R2 | R3 |
|---|---|---|---|---|---|---|---|
| Standard | 0.3159 | 0.3679 | 0.3959 | 0.4479 | 0.4759 | 0.5279 | 0.5559 |
| Camarilla | 0.4018 | 0.4091 | 0.4165 | 0.4238 | 0.4311 | 0.4385 | 0.4458 |
| Woodie | 0.3038 | 0.3619 | 0.3838 | 0.4419 | 0.4638 | 0.5219 | 0.5438 |
| Fibonacci | 0.3679 | 0.3985 | 0.4174 | 0.4479 | 0.4785 | 0.4974 | 0.5279 |
Numerical data
The following is the status of the technical indicators and moving averages at the time of publication of this technical analysis:
| RSI (14): | 80.35 | |
| MACD (12,26,9): | 0.0287 | |
| Directional Movement: | 49.8552 | |
| AROON (14): | 85.7143 | |
| DEMA (21): | 0.5496 | |
| Parabolic SAR (0,02-0,02-0,2): | 0.4641 | |
| Elder Ray (13): | 0.0788 | |
| Super Trend (3,10): | 0.5042 | |
| Zig ZAG (10): | 0.6800 | |
| VORTEX (21): | 1.1077 | |
| Stochastique (14,3,5): | 74.79 | |
| TEMA (21): | 0.5791 | |
| Williams %R (14): | -7.59 | |
| Chande Momentum Oscillator (20): | 0.1950 | |
| Repulse (5,40,3): | 26.5297 | |
| ROCnROLL: | 1 | |
| TRIX (15,9): | 0.4232 | |
| Courbe Coppock: | 37.34 |
| MA7: | 0.5474 | |
| MA20: | 0.5050 | |
| MA50: | 0.4840 | |
| MA100: | 0.5437 | |
| MAexp7: | 0.5615 | |
| MAexp20: | 0.5220 | |
| MAexp50: | 0.5127 | |
| MAexp100: | 0.5672 | |
| Price / MA7: | +20.11% | |
| Price / MA20: | +30.20% | |
| Price / MA50: | +35.85% | |
| Price / MA100: | +20.93% | |
| Price / MAexp7: | +17.10% | |
| Price / MAexp20: | +25.96% | |
| Price / MAexp50: | +28.24% | |
| Price / MAexp100: | +15.92% |
News
The latest news and videos published on NOVACYT at the time of the analysis were as follows:
- Novacyt S.A. ("Novacyt", the "Company" or the "Group"): DHSC Claim Update – Trial Date Listed
- Novacyt S.A. ("Novacyt", the "Company" or the "Group") Full Year 2022 Trading Update
- Novacyt S.A. ("Novacyt", the "Company" or the "Group"): Non-Executive Director Change
- Novacyt S.A. ("Novacyt", the "Company" or the "Group"): Approval of genesig® COVID-19 3G PCR Test in the UK Under CTDA Legislation
- Novacyt S.A. ("Novacyt", the "Company" or the "Group"): Directorate Change
About author
Online


Add a comment
Comments
0 comments on the analysis NOVACYT - Daily