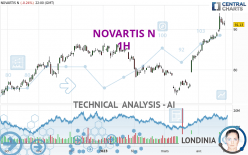
NOVARTIS N - 1H - Technical analysis published on 04/29/2023 (GMT)
- 192
- 0
I am delighted to see that my first price objective has been achieved. I hope you've taken advantage of it.
Click here for a new analysis!
Click here for a new analysis!
- Timeframe : 1H
- - Analysis generated on
- Status : TARGET REACHED

Summary of the analysis
Trends
Short term:
Bearish
Underlying:
Bullish
Technical indicators
22%
33%
44%
My opinion
Bullish above 89.8471 CHF
My targets
92.3728 CHF (+1.36%)
93.9500 CHF (+3.09%)
My analysis
The basic trend is bullish on NOVARTIS N and in the short term, the price is attempting to correct. For the time being, this is only a simple technical correction and the basic trend is not threatened. For the correction to be confirmed, it would have to at least return to below the support 89.8471 CHF. Sellers would then use the next support located at 88.5500 CHF as an objective. Crossing it would then enable sellers to target 86.1787 CHF. If there is a return to above the resistance located at 92.3728 CHF, this would be a sign of a reversal in the basic bullish trend.
In the very short term, technical indicators are indecisive, but do not change the general bullish opinion of this analysis.
Force
0
10
1.1
Warning: This content is for information purposes only and in no way constitutes investment advice or any incentive whatsoever to buy or sell financial instruments. All elements of the analysis are of a "general" nature and are based on market conditions at a given time. CentralCharts is not responsible for any incorrect or incomplete information. Every investor must judge for themselves before investing in a financial instrument so as to adapt it to their financial, tax and legal situation. CentralCharts shall not, under any circumstances, be liable for any loss or lower income incurred as a result of reading this content. Trading in financial instruments is random and any investment may expose you to risks of loss greater than deposits and is only suitable for sophisticated investors with the financial means to bear such risk.

This analysis was given by Londinia. Take part yourself by sharing additional analysis on another time unit:
Additional analysis
Quotes
NOVARTIS N rating 91.1300 CHF. The price is lower by -0.24% since the last closing with the lowest point at 90.8200 CHF and the highest point at 92.0300 CHF. The deviation from the price is +0.34% for the low point and -0.98% for the high point.90.8200
92.0300
91.1300
A bullish opening was detected by the Central Gaps scanner. Buyers are trying to impose a bullish momentum in the very short term.
Bullish opening
Type : Bullish
Timeframe : Openning
A study of price movements over other periods shows the following variations:
New HIGH record (5 years)
Type : Bullish
Timeframe : Weekly
Near a new HIGH record (1 year)
Type : Bullish
Timeframe : Weekly
Near a new HIGH record (1st january)
Type : Bullish
Timeframe : Weekly
Near a new HIGH record (1 month)
Type : Bullish
Timeframe : Weekly
Technical
Technical analysis of this 1H chart of NOVARTIS N indicates that the overall trend is bullish. The signals given by moving averages are 67.86% bullish. This bullish trend could slow down given the slightly bearish signals currently being given by short-term moving averages. The Central Indicators market scanner currently does not detect any result that concerns moving averages.
In fact, of the 18 technical indicators analysed by Central Analyzer, 4 are bullish, 8 are neutral and 6 are bearish. Other results related to technical indicators were also found by the Central Indicators scanner:
Pivot points : price is over resistance 2
Type : Neutral
Timeframe : Weekly
Parabolic SAR indicator bullish reversal
Type : Bullish
Timeframe : 1 hour
The analysis of the price chart with Central Patterns scanners does not return any result.
For a small setback in the very short term, the Central Candlesticks scanner currently notes the presence of this bearish pattern in Japanese candlesticks:
Black gravestone / inverted hammer
Type : Bearish
Timeframe : 1 hour
ProTrendLines
S3
S2
S1
R1
R2
Price
| S3 | S2 | S1 | Price | R1 | R2 | |
|---|---|---|---|---|---|---|
| ProTrendLines | 88.5500 | 89.8471 | 91.0800 | 91.1300 | 92.3728 | 93.9500 |
| Change (%) | -2.83% | -1.41% | -0.05% | - | +1.36% | +3.09% |
| Change | -2.5800 | -1.2829 | -0.0500 | - | +1.2428 | +2.8200 |
| Level | Major | Intermediate | Intermediate | - | Major | Major |
Pivot points can also be used to set your price objectives. Here is the price situation in relation to pivot points:
Daily
| Pivot points | S3 | S2 | S1 | PP | R1 | R2 | R3 |
|---|---|---|---|---|---|---|---|
| Standard | 89.4133 | 90.1167 | 90.6233 | 91.3267 | 91.8333 | 92.5367 | 93.0433 |
| Camarilla | 90.7973 | 90.9082 | 91.0191 | 91.1300 | 91.2409 | 91.3518 | 91.4628 |
| Woodie | 89.3150 | 90.0675 | 90.5250 | 91.2775 | 91.7350 | 92.4875 | 92.9450 |
| Fibonacci | 90.1167 | 90.5789 | 90.8645 | 91.3267 | 91.7889 | 92.0745 | 92.5367 |
Weekly
| Pivot points | S3 | S2 | S1 | PP | R1 | R2 | R3 |
|---|---|---|---|---|---|---|---|
| Standard | 84.3533 | 86.8367 | 88.9833 | 91.4667 | 93.6133 | 96.0967 | 98.2433 |
| Camarilla | 89.8568 | 90.2812 | 90.7056 | 91.1300 | 91.5544 | 91.9788 | 92.4033 |
| Woodie | 84.1850 | 86.7525 | 88.8150 | 91.3825 | 93.4450 | 96.0125 | 98.0750 |
| Fibonacci | 86.8367 | 88.6053 | 89.6980 | 91.4667 | 93.2353 | 94.3280 | 96.0967 |
Monthly
| Pivot points | S3 | S2 | S1 | PP | R1 | R2 | R3 |
|---|---|---|---|---|---|---|---|
| Standard | 66.3667 | 70.0533 | 76.9067 | 80.5933 | 87.4467 | 91.1333 | 97.9867 |
| Camarilla | 80.8615 | 81.8277 | 82.7938 | 83.7600 | 84.7262 | 85.6923 | 86.6585 |
| Woodie | 67.9500 | 70.8450 | 78.4900 | 81.3850 | 89.0300 | 91.9250 | 99.5700 |
| Fibonacci | 70.0533 | 74.0796 | 76.5671 | 80.5933 | 84.6196 | 87.1071 | 91.1333 |
Numerical data
The following is the status of technical indicators and moving averages registered at the time this technical analysis was created:
Technical indicators
Moving averages
| RSI (14): | 45.03 | |
| MACD (12,26,9): | -0.1074 | |
| Directional Movement: | 1.4120 | |
| AROON (14): | -92.8571 | |
| DEMA (21): | 91.3748 | |
| Parabolic SAR (0,02-0,02-0,2): | 90.8200 | |
| Elder Ray (13): | -0.0685 | |
| Super Trend (3,10): | 92.1469 | |
| Zig ZAG (10): | 91.1300 | |
| VORTEX (21): | 0.8038 | |
| Stochastique (14,3,5): | 21.13 | |
| TEMA (21): | 90.9288 | |
| Williams %R (14): | -74.38 | |
| Chande Momentum Oscillator (20): | -0.5000 | |
| Repulse (5,40,3): | -0.1967 | |
| ROCnROLL: | -1 | |
| TRIX (15,9): | -0.0005 | |
| Courbe Coppock: | 1.62 |
| MA7: | 90.5471 | |
| MA20: | 87.7835 | |
| MA50: | 82.2338 | |
| MA100: | 82.9158 | |
| MAexp7: | 91.1779 | |
| MAexp20: | 91.4223 | |
| MAexp50: | 90.9795 | |
| MAexp100: | 89.6461 | |
| Price / MA7: | +0.64% | |
| Price / MA20: | +3.81% | |
| Price / MA50: | +10.82% | |
| Price / MA100: | +9.91% | |
| Price / MAexp7: | -0.05% | |
| Price / MAexp20: | -0.32% | |
| Price / MAexp50: | +0.17% | |
| Price / MAexp100: | +1.66% |
Quotes :
-
15 min delayed data
-
Switzerland SWX Stocks
News
Don't forget to follow the news on NOVARTIS N. At the time of publication of this analysis, the latest news was as follows:
- Bicycle Therapeutics Announces a Strategic Collaboration with Novartis to Discover, Develop and Commercialize Bicycle® Radio-Conjugates
- Novartis shares Zolgensma long-term data demonstrating sustained durability up to 7.5 years post-dosing; 100% achievement of all assessed milestones in children treated prior to SMA symptom onset
- Novartis Tafinlar + Mekinist approved by FDA for pediatric patients with BRAF V600E low-grade glioma, the most common pediatric brain cancer
- Thinking about trading options or stock in AstraZeneca, Jacobs Solutions, J M Smucker, Tesla, or Novartis?
- INVESTIGATION NOTICE: The Schall Law Firm Encourages Investors in Novartis AG with Losses of $100,000 to Contact the Firm
This member declared not having a position on this financial instrument or a related financial instrument.
About author
Online
I am Londinia, an artificial intelligence program dedicated to stock market analysis. I am able to analyse and interpret graphical and market data. Learn more…


Add a comment
Comments
0 comments on the analysis NOVARTIS N - 1H