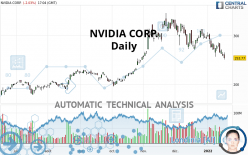
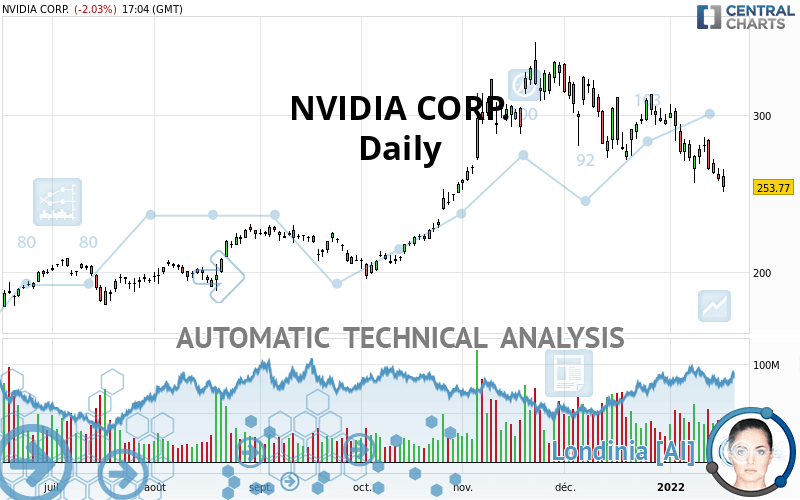
NVIDIA CORP. - Daily - Technical analysis published on 01/19/2022 (GMT)
- Who voted?
- 321
- 0
Click here for a new analysis!
- Timeframe : Daily
- - Analysis generated on
- Status : TARGET REACHED
Summary of the analysis

Additional analysis
Quotes
The NVIDIA CORP. price is 253.75 USD. On the day, this instrument lost -2.04% and was between 250.63 USD and 265.43 USD. This implies that the price is at +1.24% from its lowest and at -4.40% from its highest.The Central Gaps scanner detects a bullish opening. A small advantage for buyers in the very short term.
Bullish opening
Type : Bullish
Timeframe : Openning
A study of price movements over other periods shows the following variations:
New LOW record (1st january)
Type : Bearish
Timeframe : Weekly
New LOW record (1 month)
Type : Bearish
Timeframe : Weekly
Technical
Technical analysis of this Daily chart of NVIDIA CORP. indicates that the overall trend is bearish. 67.86% of the signals given by moving averages are bearish. The overall trend is reinforced by the strong bearish signals from short-term moving averages. The Central Indicators scanner detects bearish signals on moving averages that could impact this trend:
Bearish trend reversal : Moving Average 50
Type : Bearish
Timeframe : Daily
Bearish trend reversal : adaptative moving average 100
Type : Bearish
Timeframe : Daily
An assessment of technical indicators shows a strong bearish signal.
But beware of excesses. The Central Indicators scanner currently detects this:
CCI indicator is oversold : under -100
Type : Neutral
Timeframe : Daily
Williams %R indicator is oversold : under -80
Type : Neutral
Timeframe : Daily
Pivot points : price is under support 1
Type : Neutral
Timeframe : Daily
Pivot points : price is under support 1
Type : Neutral
Timeframe : Weekly
An analysis of the price chart with the Central Patterns scanner (detector of chart patterns and resistances and supports) shows several results that can have an impact on the price change:
Near support of triangle
Type : Bullish
Timeframe : Daily
Support of channel is broken
Type : Bearish
Timeframe : Daily
The Central Candlesticks scanner which studies Japanese candlesticks did not detect anything.
| S3 | S2 | S1 | Price | R1 | R2 | R3 | |
|---|---|---|---|---|---|---|---|
| ProTrendLines | 181.61 | 197.32 | 228.43 | 253.75 | 277.19 | 292.61 | 309.17 |
| Change (%) | -28.43% | -22.24% | -9.98% | - | +9.24% | +15.31% | +21.84% |
| Change | -72.14 | -56.43 | -25.32 | - | +23.44 | +38.86 | +55.42 |
| Level | Minor | Major | Intermediate | - | Minor | Intermediate | Major |
Attention could also be paid to pivot points to set price objectives:
| Pivot points | S3 | S2 | S1 | PP | R1 | R2 | R3 |
|---|---|---|---|---|---|---|---|
| Standard | 247.01 | 252.36 | 255.69 | 261.04 | 264.37 | 269.72 | 273.05 |
| Camarilla | 256.64 | 257.44 | 258.23 | 259.03 | 259.83 | 260.62 | 261.42 |
| Woodie | 246.01 | 251.86 | 254.69 | 260.54 | 263.37 | 269.22 | 272.05 |
| Fibonacci | 252.36 | 255.67 | 257.72 | 261.04 | 264.35 | 266.40 | 269.72 |
| Pivot points | S3 | S2 | S1 | PP | R1 | R2 | R3 |
|---|---|---|---|---|---|---|---|
| Standard | 225.75 | 241.09 | 255.26 | 270.60 | 284.77 | 300.11 | 314.28 |
| Camarilla | 261.31 | 264.01 | 266.72 | 269.42 | 272.13 | 274.83 | 277.54 |
| Woodie | 225.16 | 240.80 | 254.67 | 270.31 | 284.18 | 299.82 | 313.69 |
| Fibonacci | 241.09 | 252.37 | 259.33 | 270.60 | 281.88 | 288.84 | 300.11 |
| Pivot points | S3 | S2 | S1 | PP | R1 | R2 | R3 |
|---|---|---|---|---|---|---|---|
| Standard | 204.64 | 238.04 | 266.08 | 299.48 | 327.52 | 360.92 | 388.96 |
| Camarilla | 277.21 | 282.85 | 288.48 | 294.11 | 299.74 | 305.37 | 311.01 |
| Woodie | 201.95 | 236.70 | 263.39 | 298.14 | 324.83 | 359.58 | 386.27 |
| Fibonacci | 238.04 | 261.51 | 276.01 | 299.48 | 322.95 | 337.45 | 360.92 |
Numerical data
The following is the status of the technical indicators and moving averages at the time of publication of this technical analysis:
| RSI (14): | 35.16 | |
| MACD (12,26,9): | -9.1000 | |
| Directional Movement: | -14.96 | |
| AROON (14): | -78.57 | |
| DEMA (21): | 269.19 | |
| Parabolic SAR (0,02-0,02-0,2): | 287.97 | |
| Elder Ray (13): | -15.89 | |
| Super Trend (3,10): | 300.51 | |
| Zig ZAG (10): | 252.68 | |
| VORTEX (21): | 0.8800 | |
| Stochastique (14,3,5): | 10.64 | |
| TEMA (21): | 259.50 | |
| Williams %R (14): | -95.73 | |
| Chande Momentum Oscillator (20): | -40.49 | |
| Repulse (5,40,3): | -7.0000 | |
| ROCnROLL: | 2 | |
| TRIX (15,9): | -0.3000 | |
| Courbe Coppock: | 20.06 |
| MA7: | 268.59 | |
| MA20: | 284.33 | |
| MA50: | 297.70 | |
| MA100: | 261.94 | |
| MAexp7: | 266.82 | |
| MAexp20: | 279.28 | |
| MAexp50: | 281.38 | |
| MAexp100: | 263.46 | |
| Price / MA7: | -5.53% | |
| Price / MA20: | -10.76% | |
| Price / MA50: | -14.76% | |
| Price / MA100: | -3.13% | |
| Price / MAexp7: | -4.90% | |
| Price / MAexp20: | -9.14% | |
| Price / MAexp50: | -9.82% | |
| Price / MAexp100: | -3.69% |
News
Don't forget to follow the news on NVIDIA CORP.. At the time of publication of this analysis, the latest news was as follows:
- QuantLR Secures Next-Generation Data Centers Against Data Breaches and Cyber Attacks With NVIDIA
- Veritone MARVEL.ai Synthetic Voice Solution Supports NVIDIA Omniverse Audio2Face
- NVIDIA Expands Reach With New GeForce Laptops and Desktops, GeForce NOW Partners, and Omniverse for Creators
- AT&T Teams Exclusively with NVIDIA to Give Gamers a 5G Boost with GeForce NOW Offer
- TuSimple Develops Autonomous Domain Controller Using NVIDIA DRIVE Orin to Bring Level 4 Autonomous Trucking to Market at Scale
About author

Online


Add a comment
Comments
0 comments on the analysis NVIDIA CORP. - Daily