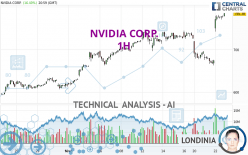
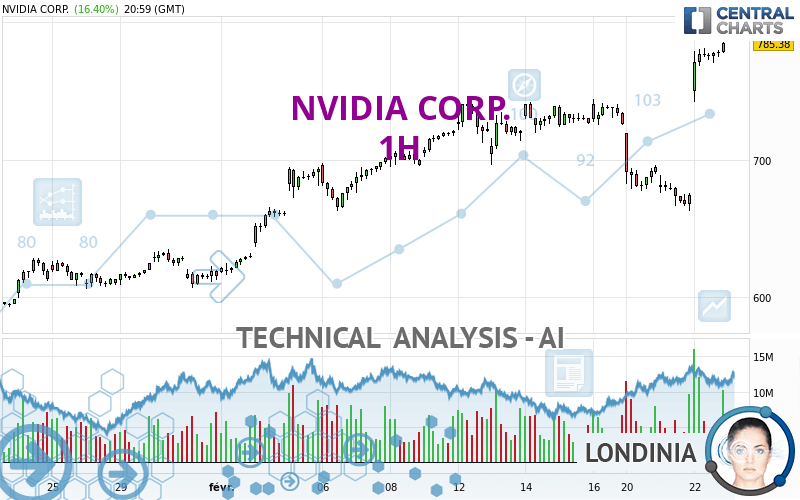
NVIDIA CORP. - 1H - Technical analysis published on 02/23/2024 (GMT)
- 81
- 0
Click here for a new analysis!
- Timeframe : 1H
- - Analysis generated on
- Status : TARGET REACHED
Summary of the analysis

Additional analysis
Quotes
The NVIDIA CORP. rating is 785.38 USD. The price registered an increase of +16.40% on the session and was traded between 742.20 USD and 785.75 USD over the period. The price is currently at +5.82% from its lowest and -0.05% from its highest.The Central Gaps scanner detects a bullish gap which is a sign that buyers have taken the lead in the very short term.
Opening Gap UP
Type : Bullish
Timeframe : Openning
A study of price movements over other periods shows the following variations:
New HIGH record (5 years)
Type : Bullish
Timeframe : Weekly
New HIGH record (1 year)
Type : Bullish
Timeframe : Weekly
New HIGH record (1st january)
Type : Bullish
Timeframe : Weekly
New HIGH record (1 month)
Type : Bullish
Timeframe : Weekly
Technical
A technical analysis in 1H of this NVIDIA CORP. chart shows a strongly bullish trend. 89.29% of the signals given by moving averages are bullish. The overall trend is supported by the strong bullish signals from short-term moving averages. The Central Indicators market scanner currently does not detect any result that concerns moving averages.
An assessment of technical indicators shows a strong bullish signal.
But beware of excesses. The Central Indicators scanner currently detects this:
RSI indicator is overbought : over 70
Type : Neutral
Timeframe : 1 hour
CCI indicator is overbought : over 100
Type : Neutral
Timeframe : 1 hour
Williams %R indicator is overbought : over -20
Type : Neutral
Timeframe : 1 hour
Pivot points : price is over resistance 2
Type : Neutral
Timeframe : Weekly
Pivot points : price is over resistance 3
Type : Neutral
Timeframe : 1 hour
The Central Patterns scanner, which studies chart patterns, resistances and supports, has identified this signal:
Near horizontal support
Type : Bullish
Timeframe : 1 hour
No result was found by the Central Candlesticks scanner on Japanese candlesticks.
| S3 | S2 | S1 | Price | |
|---|---|---|---|---|
| ProTrendLines | 662.91 | 739.00 | 781.54 | 785.38 |
| Change (%) | -15.59% | -5.91% | -0.49% | - |
| Change | -122.47 | -46.38 | -3.84 | - |
| Level | Intermediate | Major | Minor | - |
To determine price objectives, it is also possible to use the pivot points. Here is the price position in relation to pivot points:
| Pivot points | S3 | S2 | S1 | PP | R1 | R2 | R3 |
|---|---|---|---|---|---|---|---|
| Standard | 712.92 | 727.56 | 756.47 | 771.11 | 800.02 | 814.66 | 843.57 |
| Camarilla | 773.40 | 777.40 | 781.39 | 785.38 | 789.37 | 793.36 | 797.36 |
| Woodie | 720.06 | 731.13 | 763.61 | 774.68 | 807.16 | 818.23 | 850.71 |
| Fibonacci | 727.56 | 744.20 | 754.47 | 771.11 | 787.75 | 798.02 | 814.66 |
| Pivot points | S3 | S2 | S1 | PP | R1 | R2 | R3 |
|---|---|---|---|---|---|---|---|
| Standard | 649.61 | 672.90 | 699.52 | 722.81 | 749.43 | 772.72 | 799.34 |
| Camarilla | 712.41 | 716.98 | 721.56 | 726.13 | 730.71 | 735.28 | 739.86 |
| Woodie | 651.27 | 673.73 | 701.18 | 723.64 | 751.09 | 773.55 | 801.00 |
| Fibonacci | 672.90 | 691.97 | 703.75 | 722.81 | 741.88 | 753.66 | 772.72 |
| Pivot points | S3 | S2 | S1 | PP | R1 | R2 | R3 |
|---|---|---|---|---|---|---|---|
| Standard | 352.27 | 412.74 | 514.00 | 574.47 | 675.73 | 736.20 | 837.46 |
| Camarilla | 570.79 | 585.62 | 600.45 | 615.27 | 630.10 | 644.92 | 659.75 |
| Woodie | 372.68 | 422.94 | 534.41 | 584.67 | 696.14 | 746.40 | 857.87 |
| Fibonacci | 412.74 | 474.52 | 512.69 | 574.47 | 636.25 | 674.42 | 736.20 |
Numerical data
The following are the details of the technical indicators and moving averages that were collected to generate this technical analysis:
| RSI (14): | 74.79 | |
| MACD (12,26,9): | 18.3900 | |
| Directional Movement: | 25.95 | |
| AROON (14): | 50.00 | |
| DEMA (21): | 753.46 | |
| Parabolic SAR (0,02-0,02-0,2): | 692.28 | |
| Elder Ray (13): | 35.40 | |
| Super Trend (3,10): | 739.56 | |
| Zig ZAG (10): | 785.38 | |
| VORTEX (21): | 0.9500 | |
| Stochastique (14,3,5): | 97.97 | |
| TEMA (21): | 772.12 | |
| Williams %R (14): | -0.30 | |
| Chande Momentum Oscillator (20): | 105.34 | |
| Repulse (5,40,3): | 2.0800 | |
| ROCnROLL: | 1 | |
| TRIX (15,9): | 0.1000 | |
| Courbe Coppock: | 22.73 |
| MA7: | 723.94 | |
| MA20: | 683.52 | |
| MA50: | 584.41 | |
| MA100: | 520.19 | |
| MAexp7: | 765.57 | |
| MAexp20: | 735.28 | |
| MAexp50: | 720.61 | |
| MAexp100: | 699.42 | |
| Price / MA7: | +8.49% | |
| Price / MA20: | +14.90% | |
| Price / MA50: | +34.39% | |
| Price / MA100: | +50.98% | |
| Price / MAexp7: | +2.59% | |
| Price / MAexp20: | +6.81% | |
| Price / MAexp50: | +8.99% | |
| Price / MAexp100: | +12.29% |
News
The latest news and videos published on NVIDIA CORP. at the time of the analysis were as follows:
- NVIDIA Announces Upcoming Events for Financial Community
-
 NVIDIA Daily Forecast and Technical Analysis for February 22, 2024, by Chris Lewis for FX Empire
-
NVIDIA shares close in on record high after Q4
-
The rollercoaster ride of #NVIDIA shares after earnings
- NVIDIA Announces Financial Results for Fourth Quarter and Fiscal 2024
About author

Online


Add a comment
Comments
0 comments on the analysis NVIDIA CORP. - 1H