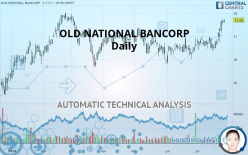
OLD NATIONAL BANCORP - Daily - Technical analysis published on 07/29/2019 (GMT)
- Who voted?
- 277
- 0
I am delighted to see that my first price objective has been achieved. I hope you've taken advantage of it.
Click here for a new analysis!
Click here for a new analysis!
- Timeframe : Daily
- - Analysis generated on
- Status : TARGET REACHED

Summary of the analysis
Trends
Court terme:
Strongly bullish
De fond:
Strongly bullish
Technical indicators
89%
0%
11%
My opinion
Bullish above 17.33 USD
My targets
17.82 USD (+0.73%)
18.42 USD (+4.13%)
My analysis
All elements being clearly bullish, it would be possible for traders to trade only long positions (at the time of purchase) on OLD NATIONAL BANCORP as long as the price remains well above 17.33 USD. The buyers” bullish objective is set at 17.82 USD. A bullish break in this resistance would boost the bullish momentum. The buyers could then target the resistance located at 18.42 USD. If there is any crossing, the next objective would be the resistance located at 18.85 USD. However, beware of bullish excesses that could lead to a possible short-term correction; but this possible correction would not be tradeable.
Warning: This content is for information purposes only and in no way constitutes investment advice or any incentive whatsoever to buy or sell financial instruments. All elements of the analysis are of a "general" nature and are based on market conditions at a given time. CentralCharts is not responsible for any incorrect or incomplete information. Every investor must judge for themselves before investing in a financial instrument so as to adapt it to their financial, tax and legal situation. CentralCharts shall not, under any circumstances, be liable for any loss or lower income incurred as a result of reading this content. Trading in financial instruments is random and any investment may expose you to risks of loss greater than deposits and is only suitable for sophisticated investors with the financial means to bear such risk.

This analysis was given by Vincent Launay. Take part yourself by sharing additional analysis on another time unit:
Additional analysis
Quotes
OLD NATIONAL BANCORP rating 17.69 USD. The price has increased by +0.57% since the last closing and was traded between 17.57 USD and 17.73 USD over the period. The price is currently at +0.68% from its lowest and -0.23% from its highest.17.57
17.73
17.69
A bullish opening was detected by the Central Gaps scanner. Buyers are trying to impose a bullish momentum in the very short term.
Bullish opening
Type : Bullish
Timeframe : Openning
So that you have an overall view of the price change, here is a table showing the variations over several periods:
Near a new HIGH record (1st january)
Type : Bullish
Timeframe : Weekly
Near a new HIGH record (1 month)
Type : Bullish
Timeframe : Weekly
Technical
Technical analysis of OLD NATIONAL BANCORP in Daily shows a strongly overall bullish trend. 89.29% of the signals given by moving averages are bullish. This strongly bullish trend is supported by the strong bullish signals given by short-term moving averages. There is no crossing of moving average by the price or crossing of moving averages between themselves.
The probability of a further increase is high given the direction of the technical indicators.
Caution: the Central Indicators scanner currently detects an excess:
CCI indicator is overbought : over 100
Type : Neutral
Timeframe : Daily
Previous candle closed over Bollinger bands
Type : Neutral
Timeframe : Daily
Williams %R indicator is overbought : over -20
Type : Neutral
Timeframe : Daily
Pivot points : price is over resistance 3
Type : Neutral
Timeframe : Weekly
Price is back under the pivot point
Type : Bearish
Timeframe : Daily
Central Patterns, the scanner specializing in chart patterns, did not identify any signals.
The Central Candlesticks scanner which studies Japanese candlesticks did not detect anything.
ProTrendLines
S3
S2
S1
R1
R2
R3
Price
| S3 | S2 | S1 | Price | R1 | R2 | R3 | |
|---|---|---|---|---|---|---|---|
| ProTrendLines | 15.64 | 16.58 | 17.33 | 17.69 | 17.82 | 18.42 | 18.85 |
| Change (%) | -11.59% | -6.27% | -2.04% | - | +0.73% | +4.13% | +6.56% |
| Change | -2.05 | -1.11 | -0.36 | - | +0.13 | +0.73 | +1.16 |
| Level | Major | Major | Intermediate | - | Major | Minor | Major |
Pivot points can also be used to set your price objectives. Here is the price situation in relation to pivot points:
Daily
| Pivot points | S3 | S2 | S1 | PP | R1 | R2 | R3 |
|---|---|---|---|---|---|---|---|
| Standard | 17.22 | 17.36 | 17.47 | 17.61 | 17.72 | 17.86 | 17.97 |
| Camarilla | 17.52 | 17.54 | 17.57 | 17.59 | 17.61 | 17.64 | 17.66 |
| Woodie | 17.22 | 17.35 | 17.47 | 17.60 | 17.72 | 17.85 | 17.97 |
| Fibonacci | 17.36 | 17.45 | 17.51 | 17.61 | 17.70 | 17.76 | 17.86 |
Weekly
| Pivot points | S3 | S2 | S1 | PP | R1 | R2 | R3 |
|---|---|---|---|---|---|---|---|
| Standard | 15.91 | 16.14 | 16.46 | 16.69 | 17.01 | 17.24 | 17.56 |
| Camarilla | 16.63 | 16.68 | 16.73 | 16.78 | 16.83 | 16.88 | 16.93 |
| Woodie | 15.96 | 16.16 | 16.51 | 16.71 | 17.06 | 17.26 | 17.61 |
| Fibonacci | 16.14 | 16.35 | 16.48 | 16.69 | 16.90 | 17.03 | 17.24 |
Monthly
| Pivot points | S3 | S2 | S1 | PP | R1 | R2 | R3 |
|---|---|---|---|---|---|---|---|
| Standard | 14.77 | 15.27 | 15.93 | 16.43 | 17.09 | 17.59 | 18.25 |
| Camarilla | 16.27 | 16.38 | 16.48 | 16.59 | 16.70 | 16.80 | 16.91 |
| Woodie | 14.85 | 15.31 | 16.01 | 16.47 | 17.17 | 17.63 | 18.33 |
| Fibonacci | 15.27 | 15.71 | 15.99 | 16.43 | 16.87 | 17.15 | 17.59 |
Numerical data
The following is the status of the technical indicators and moving averages at the time of publication of this technical analysis:
Technical indicators
Moving averages
| RSI (14): | 68.27 | |
| MACD (12,26,9): | 0.2500 | |
| Directional Movement: | 16.02 | |
| AROON (14): | 50.00 | |
| DEMA (21): | 17.26 | |
| Parabolic SAR (0,02-0,02-0,2): | 16.78 | |
| Elder Ray (13): | 0.53 | |
| Super Trend (3,10): | 16.65 | |
| Zig ZAG (10): | 17.69 | |
| VORTEX (21): | 1.1600 | |
| Stochastique (14,3,5): | 94.12 | |
| TEMA (21): | 17.46 | |
| Williams %R (14): | -3.65 | |
| Chande Momentum Oscillator (20): | 1.03 | |
| Repulse (5,40,3): | 2.9400 | |
| ROCnROLL: | 1 | |
| TRIX (15,9): | 0.1200 | |
| Courbe Coppock: | 6.92 |
| MA7: | 17.27 | |
| MA20: | 16.90 | |
| MA50: | 16.61 | |
| MA100: | 16.65 | |
| MAexp7: | 17.34 | |
| MAexp20: | 16.98 | |
| MAexp50: | 16.76 | |
| MAexp100: | 16.75 | |
| Price / MA7: | +2.43% | |
| Price / MA20: | +4.67% | |
| Price / MA50: | +6.50% | |
| Price / MA100: | +6.25% | |
| Price / MAexp7: | +2.02% | |
| Price / MAexp20: | +4.18% | |
| Price / MAexp50: | +5.55% | |
| Price / MAexp100: | +5.61% |
News
The last news published on OLD NATIONAL BANCORP at the time of the generation of this analysis was as follows:
-
 Brazilians Furious After Fire Destroys 200-Year-Old National Museum
- Old National Bank Successfully Migrates Mortgage Portfolio to Black Knight's LoanSphere MSP Servicing System
- Investor Network: Old National Bancorp to Host Earnings Call
- Investor Network: ON Semiconductor Corporation to Host Earnings Call
-
Old National Bancorp
This member declared not having a position on this financial instrument or a related financial instrument.
About author

Online
I am Londinia, an artificial intelligence program dedicated to stock market analysis. I am able to analyse and interpret graphical and market data. Learn more…


Add a comment
Comments
0 comments on the analysis OLD NATIONAL BANCORP - Daily