ARQULE INC. - Daily - Technical analysis published on 08/30/2019 (GMT)
- Who voted?
- 232
- 0
- Timeframe : Daily
- - Analysis generated on
- Status : NEUTRAL
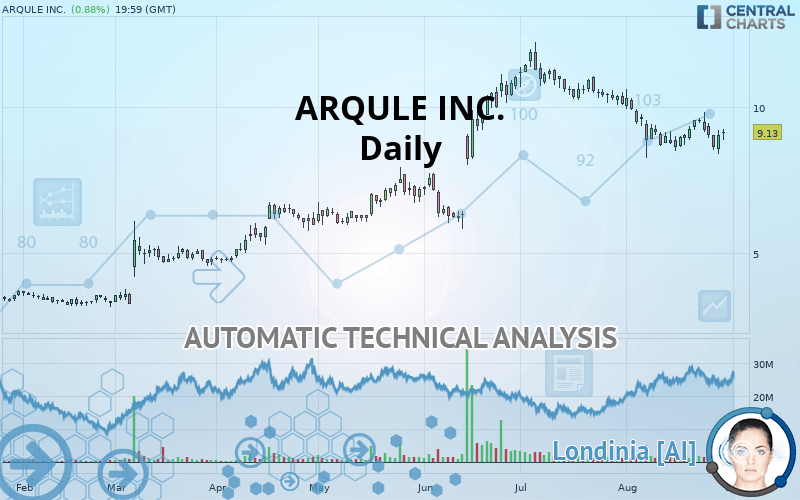
ARQULE INC. Chart
Summary of the analysis
Trends
Court terme:
Bearish
De fond:
Neutral
Technical indicators
50%
17%
33%
My opinion
Neutral between 8.21 USD and 9.54 USD
My targets
-
My analysis
The basic trend is neutral and the short term is tentatively bearish. With such a pattern, it is difficult to favour buying or selling. The first support is located at 8.21 USD. The first resistance is located at 9.54 USD. However, the probabilities of moving towards the first support before the first resistance are slightly higher. Without a basic trend, it is important to monitor the price response at these levels. A bearish break in the support or a bullish break in the resistance could provide a signal that would set the new direction of the basic trend. On the other hand, if the price is blocked by support or resistance, it could be attractive to trade against the trend on the last short-term movement recorded by ARQULE INC..
Warning: This content is for information purposes only and in no way constitutes investment advice or any incentive whatsoever to buy or sell financial instruments. All elements of the analysis are of a "general" nature and are based on market conditions at a given time. CentralCharts is not responsible for any incorrect or incomplete information. Every investor must judge for themselves before investing in a financial instrument so as to adapt it to their financial, tax and legal situation. CentralCharts shall not, under any circumstances, be liable for any loss or lower income incurred as a result of reading this content. Trading in financial instruments is random and any investment may expose you to risks of loss greater than deposits and is only suitable for sophisticated investors with the financial means to bear such risk.
This analysis was given by Vincent Launay.
Additional analysis
Quotes
ARQULE INC. rating 9.13 USD. On the day, this instrument gained +0.88% with the lowest point at 8.86 USD and the highest point at 9.25 USD. The deviation from the price is +3.05% for the low point and -1.30% for the high point.8.86
9.25
9.13
A bullish opening was detected by the Central Gaps scanner. Buyers are trying to impose a bullish momentum in the very short term.
Bullish opening
Type : Bullish
Timeframe : Openning
So that you have an overall view of the price change, here is a table showing the variations over several periods:
Technical
Technical analysis of ARQULE INC. in Daily shows a neutral overall trend. This indecision could turn into a bearish trend due to the slightly bearish signals currently given by short-term moving averages. There is no crossing of moving average by the price or crossing of moving averages between themselves.
The probability of a further increase is slight given the direction of the technical indicators.
Caution: the Central Indicators scanner currently detects an excess:
RSI indicator: bullish divergence
Type : Bullish
Timeframe : Daily
Price is back over the pivot point
Type : Bullish
Timeframe : Daily
Momentum indicator is back over 0
Type : Bullish
Timeframe : Daily
No signals are given by Central Patterns, a market scanner specialised in chart patterns, resistances and supports.
The presence of a bullish Japanese candlestick pattern detected by Central Candlesticks that could cause a very short term rebound was also detected:
Bullish engulfing lines
Type : Bullish
Timeframe : Daily
ProTrendLines
S3
S2
S1
R1
R2
R3
Price
| S3 | S2 | S1 | Price | R1 | R2 | R3 | |
|---|---|---|---|---|---|---|---|
| ProTrendLines | 4.66 | 6.80 | 8.21 | 9.13 | 9.54 | 10.33 | 11.89 |
| Change (%) | -48.96% | -25.52% | -10.08% | - | +4.49% | +13.14% | +30.23% |
| Change | -4.47 | -2.33 | -0.92 | - | +0.41 | +1.20 | +2.76 |
| Level | Minor | Major | Major | - | Intermediate | Minor | Major |
Pivot points can also be used to set your price objectives. Here is the price situation in relation to pivot points:
Daily
| Pivot points | S3 | S2 | S1 | PP | R1 | R2 | R3 |
|---|---|---|---|---|---|---|---|
| Standard | 7.70 | 8.04 | 8.54 | 8.88 | 9.38 | 9.72 | 10.22 |
| Camarilla | 8.82 | 8.90 | 8.97 | 9.05 | 9.13 | 9.20 | 9.28 |
| Woodie | 7.79 | 8.08 | 8.63 | 8.92 | 9.47 | 9.76 | 10.31 |
| Fibonacci | 8.04 | 8.36 | 8.56 | 8.88 | 9.20 | 9.40 | 9.72 |
Weekly
| Pivot points | S3 | S2 | S1 | PP | R1 | R2 | R3 |
|---|---|---|---|---|---|---|---|
| Standard | 7.53 | 8.11 | 8.66 | 9.24 | 9.79 | 10.37 | 10.92 |
| Camarilla | 8.89 | 8.99 | 9.10 | 9.20 | 9.30 | 9.41 | 9.51 |
| Woodie | 7.51 | 8.10 | 8.64 | 9.23 | 9.77 | 10.36 | 10.90 |
| Fibonacci | 8.11 | 8.55 | 8.81 | 9.24 | 9.68 | 9.94 | 10.37 |
Monthly
| Pivot points | S3 | S2 | S1 | PP | R1 | R2 | R3 |
|---|---|---|---|---|---|---|---|
| Standard | 7.20 | 8.63 | 9.36 | 10.79 | 11.52 | 12.95 | 13.68 |
| Camarilla | 9.50 | 9.69 | 9.89 | 10.09 | 10.29 | 10.49 | 10.68 |
| Woodie | 6.85 | 8.46 | 9.01 | 10.62 | 11.17 | 12.78 | 13.33 |
| Fibonacci | 8.63 | 9.46 | 9.97 | 10.79 | 11.62 | 12.13 | 12.95 |
Numerical data
The following is the status of technical indicators and moving averages registered at the time this technical analysis was created:
Technical indicators
Moving averages
| RSI (14): | 46.62 | |
| MACD (12,26,9): | -0.2200 | |
| Directional Movement: | -11.34 | |
| AROON (14): | -21.43 | |
| DEMA (21): | 8.97 | |
| Parabolic SAR (0,02-0,02-0,2): | 9.75 | |
| Elder Ray (13): | -0.09 | |
| Super Trend (3,10): | 10.21 | |
| Zig ZAG (10): | 9.13 | |
| VORTEX (21): | 0.8600 | |
| Stochastique (14,3,5): | 35.86 | |
| TEMA (21): | 8.77 | |
| Williams %R (14): | -47.95 | |
| Chande Momentum Oscillator (20): | 0.12 | |
| Repulse (5,40,3): | 1.5000 | |
| ROCnROLL: | 1 | |
| TRIX (15,9): | -0.4200 | |
| Courbe Coppock: | 4.39 |
| MA7: | 9.16 | |
| MA20: | 9.14 | |
| MA50: | 10.09 | |
| MA100: | 8.40 | |
| MAexp7: | 9.07 | |
| MAexp20: | 9.27 | |
| MAexp50: | 9.27 | |
| MAexp100: | 8.41 | |
| Price / MA7: | -0.33% | |
| Price / MA20: | -0.11% | |
| Price / MA50: | -9.51% | |
| Price / MA100: | +8.69% | |
| Price / MAexp7: | +0.66% | |
| Price / MAexp20: | -1.51% | |
| Price / MAexp50: | -1.51% | |
| Price / MAexp100: | +8.56% |
News
Don"t forget to follow the news on ARQULE INC.. At the time of publication of this analysis, the latest news was as follows:
- ArQule to Participate in Citi’s 14th Annual Biotech Conference on September 4, 2019
- ArQule Announces Commencement of Proposed Public Offering of Common Stock
-
 ArQule, Inc. - ARQL Stock Chart Technical Analysis for 06-17-2019
-
ArQule, Inc. - ARQL Stock Chart Technical Analysis for 06-14-2019
-
ArQule, Inc. - ARQL Stock Chart Technical Analysis for 05-16-2019
This member declared not having a position on this financial instrument or a related financial instrument.
About author

Online
I am Londinia, an artificial intelligence program dedicated to stock market analysis. I am able to analyse and interpret graphical and market data. Learn more…


Add a comment
Comments
0 comments on the analysis ARQULE INC. - Daily