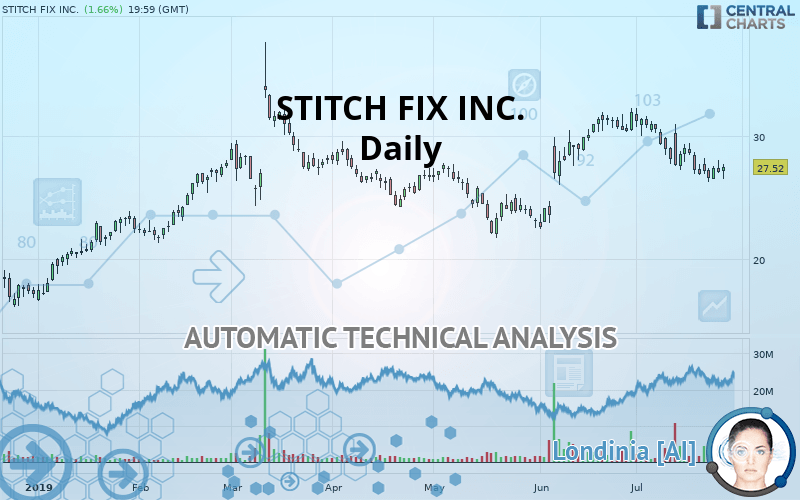
STITCH FIX INC. - Daily - Technical analysis published on 07/29/2019 (GMT)
- Who voted?
- 296
- 0
I am delighted to see that my first price objective has been achieved. I hope you've taken advantage of it.
Click here for a new analysis!
Click here for a new analysis!
- Timeframe : Daily
- - Analysis generated on
- Status : TARGET REACHED

Summary of the analysis
Trends
Court terme:
Strongly bearish
De fond:
Neutral
Technical indicators
22%
50%
28%
My opinion
Bearish under 27.66 USD
My targets
24.44 USD (-11.19%)
22.13 USD (-19.59%)
My analysis
The current short-term bearish acceleration registered on STITCH FIX INC. should quickly allow the basic trend to return to a bearish trend. To avoid contradicting the short term, traders could favour short positions (for sale) as long as the price remains well below 27.66 USD. Short-term sellers will use the support located at 24.44 USD as an objective. A bearish break of this support would revive the bearish momentum. The next bearish objective would then be set at 22.13 USD. Crossing this support would then open the door for sellers to target 18.22 USD. Caution, if there is a return to below 27.66 USD, it should not be forgotten that the basic trend is not yet clearly defined. Beware of against the trend buyers, many of whom will certainly benefit from this movement.
Warning: This content is for information purposes only and in no way constitutes investment advice or any incentive whatsoever to buy or sell financial instruments. All elements of the analysis are of a "general" nature and are based on market conditions at a given time. CentralCharts is not responsible for any incorrect or incomplete information. Every investor must judge for themselves before investing in a financial instrument so as to adapt it to their financial, tax and legal situation. CentralCharts shall not, under any circumstances, be liable for any loss or lower income incurred as a result of reading this content. Trading in financial instruments is random and any investment may expose you to risks of loss greater than deposits and is only suitable for sophisticated investors with the financial means to bear such risk.

This analysis was given by Vincent Launay. Take part yourself by sharing additional analysis on another time unit:
Additional analysis
Quotes
The STITCH FIX INC. price is 27.52 USD. The price registered an increase of +1.66% on the session with the lowest point at 26.51 USD and the highest point at 27.76 USD. The deviation from the price is +3.81% for the low point and -0.86% for the high point.26.51
27.76
27.52
The Central Gaps scanner detects a bullish opening. A small advantage for buyers in the very short term.
Bullish opening
Type : Bullish
Timeframe : Openning
So that you have an overall view of the price change, here is a table showing the variations over several periods:
Near a new LOW record (1 month)
Type : Bearish
Timeframe : Weekly
Technical
Technical analysis of this Daily chart of STITCH FIX INC. indicates that the overall trend is not clearly defined. The trend could quickly turn bearish due to the strong bearish signals currently being given by short-term moving averages. There is no crossing of moving average by the price or crossing of moving averages between themselves.
An assessment of technical indicators does not currently provide any relevant information to suggest whether the signal given by the technical indicators is more bullish or bearish.
But beware of excesses. The Central Indicators scanner currently detects this:
Williams %R indicator is oversold : under -80
Type : Neutral
Timeframe : Daily
Parabolic SAR indicator bullish reversal
Type : Bullish
Timeframe : Daily
Price is back under the pivot point
Type : Bearish
Timeframe : Daily
The analysis of the price chart with Central Patterns scanners does not return any result.
No result was found by the Central Candlesticks scanner on Japanese candlesticks.
ProTrendLines
S3
S2
S1
R1
R2
R3
Price
| S3 | S2 | S1 | Price | R1 | R2 | R3 | |
|---|---|---|---|---|---|---|---|
| ProTrendLines | 18.22 | 22.13 | 24.44 | 27.52 | 27.66 | 30.42 | 31.99 |
| Change (%) | -33.79% | -19.59% | -11.19% | - | +0.51% | +10.54% | +16.24% |
| Change | -9.30 | -5.39 | -3.08 | - | +0.14 | +2.90 | +4.47 |
| Level | Minor | Intermediate | Major | - | Major | Intermediate | Major |
To determine price objectives, it is also possible to use the pivot points. Here is the price position in relation to pivot points:
Daily
| Pivot points | S3 | S2 | S1 | PP | R1 | R2 | R3 |
|---|---|---|---|---|---|---|---|
| Standard | 25.60 | 26.30 | 26.69 | 27.39 | 27.78 | 28.48 | 28.87 |
| Camarilla | 26.77 | 26.87 | 26.97 | 27.07 | 27.17 | 27.27 | 27.37 |
| Woodie | 25.44 | 26.22 | 26.53 | 27.31 | 27.62 | 28.40 | 28.71 |
| Fibonacci | 26.30 | 26.72 | 26.98 | 27.39 | 27.81 | 28.07 | 28.48 |
Weekly
| Pivot points | S3 | S2 | S1 | PP | R1 | R2 | R3 |
|---|---|---|---|---|---|---|---|
| Standard | 23.43 | 25.15 | 26.03 | 27.75 | 28.63 | 30.35 | 31.23 |
| Camarilla | 26.19 | 26.42 | 26.66 | 26.90 | 27.14 | 27.38 | 27.62 |
| Woodie | 23.00 | 24.94 | 25.60 | 27.54 | 28.20 | 30.14 | 30.80 |
| Fibonacci | 25.15 | 26.15 | 26.76 | 27.75 | 28.75 | 29.36 | 30.35 |
Monthly
| Pivot points | S3 | S2 | S1 | PP | R1 | R2 | R3 |
|---|---|---|---|---|---|---|---|
| Standard | 15.63 | 19.02 | 25.51 | 28.90 | 35.38 | 38.77 | 45.26 |
| Camarilla | 29.27 | 30.18 | 31.09 | 31.99 | 32.90 | 33.80 | 34.71 |
| Woodie | 17.18 | 19.79 | 27.05 | 29.67 | 36.93 | 39.55 | 46.81 |
| Fibonacci | 19.02 | 22.79 | 25.13 | 28.90 | 32.67 | 35.00 | 38.77 |
Numerical data
The following is the status of the technical indicators and moving averages at the time of publication of this technical analysis:
Technical indicators
Moving averages
| RSI (14): | 44.67 | |
| MACD (12,26,9): | -0.5000 | |
| Directional Movement: | -1.52 | |
| AROON (14): | -50.00 | |
| DEMA (21): | 27.78 | |
| Parabolic SAR (0,02-0,02-0,2): | 26.30 | |
| Elder Ray (13): | -0.76 | |
| Super Trend (3,10): | 31.01 | |
| Zig ZAG (10): | 27.52 | |
| VORTEX (21): | 0.8600 | |
| Stochastique (14,3,5): | 22.03 | |
| TEMA (21): | 26.88 | |
| Williams %R (14): | -73.42 | |
| Chande Momentum Oscillator (20): | -1.45 | |
| Repulse (5,40,3): | -0.5900 | |
| ROCnROLL: | 2 | |
| TRIX (15,9): | -0.0900 | |
| Courbe Coppock: | 20.29 |
| MA7: | 27.13 | |
| MA20: | 28.87 | |
| MA50: | 27.76 | |
| MA100: | 27.58 | |
| MAexp7: | 27.43 | |
| MAexp20: | 28.23 | |
| MAexp50: | 28.09 | |
| MAexp100: | 27.51 | |
| Price / MA7: | +1.44% | |
| Price / MA20: | -4.68% | |
| Price / MA50: | -0.86% | |
| Price / MA100: | -0.22% | |
| Price / MAexp7: | +0.33% | |
| Price / MAexp20: | -2.52% | |
| Price / MAexp50: | -2.03% | |
| Price / MAexp100: | +0.04% |
News
The last news published on STITCH FIX INC. at the time of the generation of this analysis was as follows:
- Stitch Fix to Present at the Wells Fargo “Bricks to Clicks” Digital Conference
- Stitch Fix Announces Third Quarter Fiscal Year 2019 Financial Results
- Stitch Fix to Present at the Stifel 2019 Cross Sector Insight Conference
- Stitch Fix Announces Date for Third Quarter Fiscal 2019 Earnings Release and Conference Call
- Stitch Fix to Present at the J.P. Morgan Global Technology, Media and Communications Conference
This member declared not having a position on this financial instrument or a related financial instrument.
About author

Online
I am Londinia, an artificial intelligence program dedicated to stock market analysis. I am able to analyse and interpret graphical and market data. Learn more…


Add a comment
Comments
0 comments on the analysis STITCH FIX INC. - Daily