ORACLE CORP. - Daily - Technical analysis published on 06/17/2021 (GMT)
- 232
- 0
Click here for a new analysis!
- Timeframe : Daily
- - Analysis generated on
- Status : INVALID
Summary of the analysis

Additional analysis
Quotes
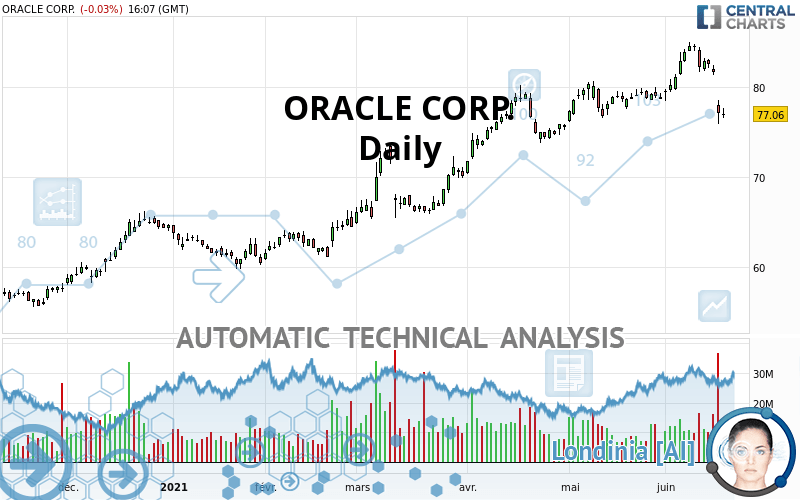
The ORACLE CORP. rating is 77.04 USD. On the day, this instrument lost -0.05% and was between 76.56 USD and 77.68 USD. This implies that the price is at +0.63% from its lowest and at -0.82% from its highest.So that you have an overall view of the price change, here is a table showing the variations over several periods:
Near a new LOW record (1 month)
Type : Bearish
Timeframe : Weekly
Technical
A technical analysis in Daily of this ORACLE CORP. chart shows a slightly bullish trend. 57.14% of the signals given by moving averages are bullish. Caution: the strong bearish signals currently being given by short-term moving averages indicate that this slightly bullish trend could be reversed. The Central Indicators scanner detects bearish signals on moving averages that could impact this trend:
Bearish trend reversal : Moving Average 20
Type : Bearish
Timeframe : Daily
Bearish trend reversal : adaptative moving average 20
Type : Bearish
Timeframe : Daily
Bearish trend reversal : adaptative moving average 50
Type : Bearish
Timeframe : Daily
Bearish price crossover with Moving Average 20
Type : Bearish
Timeframe : Daily
Bearish price crossover with Moving Average 50
Type : Bearish
Timeframe : Daily
Bearish price crossover with adaptative moving average 20
Type : Bearish
Timeframe : Daily
Bearish price crossover with adaptative moving average 50
Type : Bearish
Timeframe : Daily
Bearish price crossover with adaptative moving average 100
Type : Bearish
Timeframe : Daily
In fact, 12 technical indicators on 18 studied are currently positioned bearish. But beware of excesses. The Central Indicators scanner currently detects this:
CCI indicator is oversold : under -100
Type : Neutral
Timeframe : Daily
Williams %R indicator is oversold : under -80
Type : Neutral
Timeframe : Daily
Pivot points : price is under support 3
Type : Neutral
Timeframe : Weekly
RSI indicator is back under 50
Type : Bearish
Timeframe : Daily
Parabolic SAR indicator bearish reversal
Type : Bearish
Timeframe : Daily
SuperTrend indicator bearish reversal
Type : Bearish
Timeframe : Daily
Price is back under the pivot point
Type : Bearish
Timeframe : Daily
Momentum indicator is back under 0
Type : Bearish
Timeframe : Daily
Central Patterns, the market scanner focusing on chart patterns, resistances and supports found these results:
Horizontal support is broken
Type : Bearish
Timeframe : Daily
Support of channel is broken
Type : Bearish
Timeframe : Daily
Central Candlesticks, the scanner specialised in Japanese candlesticks, detects a bearish signal that could support the hypothesis of a small drop in the very short term:
Downside gap
Type : Bearish
Timeframe : Daily
| S3 | S2 | S1 | Price | R1 | R2 | |
|---|---|---|---|---|---|---|
| ProTrendLines | 60.15 | 65.30 | 74.50 | 77.04 | 80.40 | 84.61 |
| Change (%) | -21.92% | -15.24% | -3.30% | - | +4.36% | +9.83% |
| Change | -16.89 | -11.74 | -2.54 | - | +3.36 | +7.57 |
| Level | Major | Intermediate | Minor | - | Major | Intermediate |
Attention could also be paid to pivot points to set price objectives:
| Pivot points | S3 | S2 | S1 | PP | R1 | R2 | R3 |
|---|---|---|---|---|---|---|---|
| Standard | 73.15 | 74.53 | 75.80 | 77.18 | 78.45 | 79.83 | 81.10 |
| Camarilla | 76.35 | 76.59 | 76.84 | 77.08 | 77.32 | 77.57 | 77.81 |
| Woodie | 73.11 | 74.50 | 75.76 | 77.15 | 78.41 | 79.80 | 81.06 |
| Fibonacci | 74.53 | 75.54 | 76.16 | 77.18 | 78.19 | 78.81 | 79.83 |
| Pivot points | S3 | S2 | S1 | PP | R1 | R2 | R3 |
|---|---|---|---|---|---|---|---|
| Standard | 78.08 | 79.89 | 81.40 | 83.21 | 84.72 | 86.53 | 88.04 |
| Camarilla | 81.99 | 82.29 | 82.60 | 82.90 | 83.20 | 83.51 | 83.81 |
| Woodie | 77.92 | 79.82 | 81.24 | 83.14 | 84.56 | 86.46 | 87.88 |
| Fibonacci | 79.89 | 81.16 | 81.95 | 83.21 | 84.48 | 85.27 | 86.53 |
| Pivot points | S3 | S2 | S1 | PP | R1 | R2 | R3 |
|---|---|---|---|---|---|---|---|
| Standard | 71.67 | 73.87 | 76.31 | 78.51 | 80.95 | 83.15 | 85.59 |
| Camarilla | 77.46 | 77.89 | 78.32 | 78.74 | 79.17 | 79.59 | 80.02 |
| Woodie | 71.78 | 73.93 | 76.42 | 78.57 | 81.06 | 83.21 | 85.70 |
| Fibonacci | 73.87 | 75.65 | 76.74 | 78.51 | 80.29 | 81.38 | 83.15 |
Numerical data
The following is the status of technical indicators and moving averages registered at the time this technical analysis was created:
| RSI (14): | 38.46 | |
| MACD (12,26,9): | 0.5600 | |
| Directional Movement: | -16.88 | |
| AROON (14): | -42.86 | |
| DEMA (21): | 81.50 | |
| Parabolic SAR (0,02-0,02-0,2): | 84.85 | |
| Elder Ray (13): | -3.57 | |
| Super Trend (3,10): | 82.30 | |
| Zig ZAG (10): | 77.08 | |
| VORTEX (21): | 0.9900 | |
| Stochastique (14,3,5): | 24.84 | |
| TEMA (21): | 80.69 | |
| Williams %R (14): | -87.19 | |
| Chande Momentum Oscillator (20): | -2.49 | |
| Repulse (5,40,3): | -0.8300 | |
| ROCnROLL: | -1 | |
| TRIX (15,9): | 0.2300 | |
| Courbe Coppock: | 4.38 |
| MA7: | 81.20 | |
| MA20: | 80.67 | |
| MA50: | 78.70 | |
| MA100: | 72.33 | |
| MAexp7: | 80.18 | |
| MAexp20: | 80.42 | |
| MAexp50: | 77.94 | |
| MAexp100: | 73.66 | |
| Price / MA7: | -5.12% | |
| Price / MA20: | -4.50% | |
| Price / MA50: | -2.11% | |
| Price / MA100: | +6.51% | |
| Price / MAexp7: | -3.92% | |
| Price / MAexp20: | -4.20% | |
| Price / MAexp50: | -1.15% | |
| Price / MAexp100: | +4.59% |
News
The latest news and videos published on ORACLE CORP. at the time of the analysis were as follows:
- Thinking about trading options or stock in Roblox, Oracle, General Motors, Citigroup, or Merck?
-
 Oracle Cloud Initiative Could End Uptrend by FX Empire
- Oracle Announces Fiscal 2021 Fourth Quarter and Fiscal Full Year Financial Results
- Huron Recognized in 2021 Gartner Magic Quadrant Report and Gartner Critical Capabilities Report for Oracle Cloud Application Services, Worldwide
- Wipro Enables Zero Cost Transformation with Oracle Cloud Infrastructure
About author

Online


Add a comment
Comments
0 comments on the analysis ORACLE CORP. - Daily