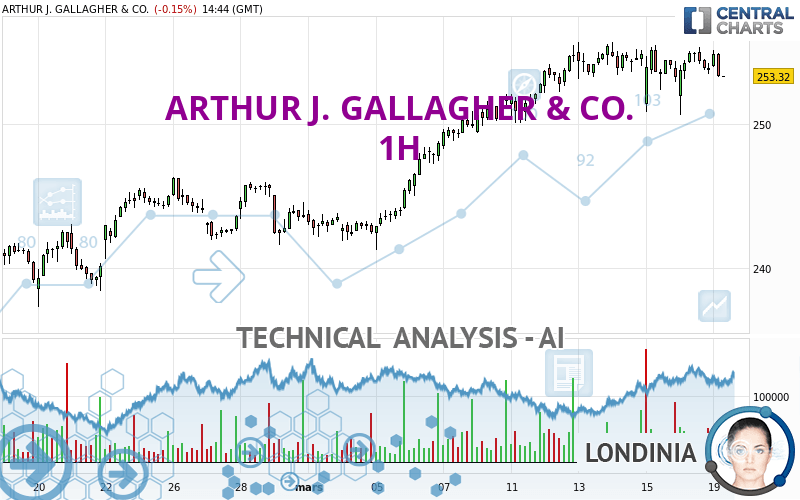
ARTHUR J. GALLAGHER & CO. - 1H - Technical analysis published on 03/19/2024 (GMT)
- 82
- 0
Click here for a new analysis!
- Timeframe : 1H
- - Analysis generated on
- Status : TARGET REACHED

Summary of the analysis

Additional analysis
Quotes
ARTHUR J. GALLAGHER & CO. rating 253.55 USD. On the day, this instrument lost -0.06% and was between 253.49 USD and 255.14 USD. This implies that the price is at +0.02% from its lowest and at -0.62% from its highest.The Central Gaps scanner detects a bullish opening marking the presence of buyers ahead of sellers at the opening but not sufficiently marked to allow the price to register a quotation gap.
Bullish opening
Type : Bullish
Timeframe : Openning
Here is a more detailed summary of the historical variations registered by ARTHUR J. GALLAGHER & CO.:
Near a new HIGH record (5 years)
Type : Bullish
Timeframe : Weekly
Near a new HIGH record (1 year)
Type : Bullish
Timeframe : Weekly
Near a new HIGH record (1st january)
Type : Bullish
Timeframe : Weekly
Near a new HIGH record (1 month)
Type : Bullish
Timeframe : Weekly
Technical
Technical analysis of this 1H chart of ARTHUR J. GALLAGHER & CO. indicates that the overall trend is bullish. The signals given by moving averages are 71.43% bullish. This bullish trend could slow down given the neutral signals currently being given by short-term moving averages. The Central Indicators market scanner is currently detecting several bearish signals that could impact this trend:
Bearish price crossover with Moving Average 20
Type : Bearish
Timeframe : 1 hour
Bearish price crossover with adaptative moving average 20
Type : Bearish
Timeframe : 1 hour
Bearish price crossover with adaptative moving average 50
Type : Bearish
Timeframe : 1 hour
The technical indicators are generally neutral. They do not provide relevant information on the direction of future price movements.
Central Indicators, the scanner specialised in technical indicators, has identified these signals:
RSI indicator is back under 50
Type : Bearish
Timeframe : 1 hour
Price is back over the pivot point
Type : Bullish
Timeframe : Weekly
An analysis of the price chart with the Central Patterns scanner (detector of chart patterns and resistances and supports) shows a result that can have an impact on the price change:
Support of channel is broken
Type : Bearish
Timeframe : 1 hour
Central Candlesticks, the scanner specialised in Japanese candlesticks, detects a bearish signal that could support the hypothesis of a small drop in the very short term:
Bearish engulfing lines
Type : Bearish
Timeframe : 1 hour
| S3 | S2 | S1 | Price | R1 | |
|---|---|---|---|---|---|
| ProTrendLines | 241.31 | 245.69 | 251.62 | 253.55 | 255.60 |
| Change (%) | -4.83% | -3.10% | -0.76% | - | +0.81% |
| Change | -12.24 | -7.86 | -1.93 | - | +2.05 |
| Level | Major | Minor | Major | - | Intermediate |
To determine price objectives, it is also possible to use the pivot points. Here is the price position in relation to pivot points:
| Pivot points | S3 | S2 | S1 | PP | R1 | R2 | R3 |
|---|---|---|---|---|---|---|---|
| Standard | 246.31 | 248.46 | 251.08 | 253.23 | 255.85 | 258.00 | 260.62 |
| Camarilla | 252.38 | 252.82 | 253.25 | 253.69 | 254.13 | 254.57 | 255.00 |
| Woodie | 246.54 | 248.58 | 251.31 | 253.35 | 256.08 | 258.12 | 260.85 |
| Fibonacci | 248.46 | 250.29 | 251.41 | 253.23 | 255.06 | 256.18 | 258.00 |
| Pivot points | S3 | S2 | S1 | PP | R1 | R2 | R3 |
|---|---|---|---|---|---|---|---|
| Standard | 244.65 | 247.37 | 250.27 | 252.99 | 255.89 | 258.61 | 261.51 |
| Camarilla | 251.63 | 252.14 | 252.66 | 253.17 | 253.69 | 254.20 | 254.72 |
| Woodie | 244.74 | 247.42 | 250.36 | 253.04 | 255.98 | 258.66 | 261.60 |
| Fibonacci | 247.37 | 249.52 | 250.84 | 252.99 | 255.14 | 256.46 | 258.61 |
| Pivot points | S3 | S2 | S1 | PP | R1 | R2 | R3 |
|---|---|---|---|---|---|---|---|
| Standard | 213.15 | 220.01 | 231.97 | 238.83 | 250.79 | 257.65 | 269.61 |
| Camarilla | 238.76 | 240.48 | 242.21 | 243.93 | 245.66 | 247.38 | 249.11 |
| Woodie | 215.70 | 221.29 | 234.52 | 240.11 | 253.34 | 258.93 | 272.16 |
| Fibonacci | 220.01 | 227.20 | 231.64 | 238.83 | 246.02 | 250.46 | 257.65 |
Numerical data
The following are the details of the technical indicators and moving averages that were collected to generate this technical analysis:
| RSI (14): | 48.31 | |
| MACD (12,26,9): | 0.2000 | |
| Directional Movement: | -10.77 | |
| AROON (14): | -35.72 | |
| DEMA (21): | 254.53 | |
| Parabolic SAR (0,02-0,02-0,2): | 250.99 | |
| Elder Ray (13): | 0.05 | |
| Super Trend (3,10): | 251.78 | |
| Zig ZAG (10): | 253.75 | |
| VORTEX (21): | 0.9900 | |
| Stochastique (14,3,5): | 70.95 | |
| TEMA (21): | 254.00 | |
| Williams %R (14): | -37.96 | |
| Chande Momentum Oscillator (20): | 0.21 | |
| Repulse (5,40,3): | -0.4600 | |
| ROCnROLL: | -1 | |
| TRIX (15,9): | 0.0200 | |
| Courbe Coppock: | 0.17 |
| MA7: | 254.06 | |
| MA20: | 248.16 | |
| MA50: | 239.98 | |
| MA100: | 238.45 | |
| MAexp7: | 254.17 | |
| MAexp20: | 254.14 | |
| MAexp50: | 252.84 | |
| MAexp100: | 249.94 | |
| Price / MA7: | -0.20% | |
| Price / MA20: | +2.17% | |
| Price / MA50: | +5.65% | |
| Price / MA100: | +6.33% | |
| Price / MAexp7: | -0.24% | |
| Price / MAexp20: | -0.23% | |
| Price / MAexp50: | +0.28% | |
| Price / MAexp100: | +1.44% |
News
Don't forget to follow the news on ARTHUR J. GALLAGHER & CO.. At the time of publication of this analysis, the latest news was as follows:
- Arthur J. Gallagher & Co. To Host Regularly Scheduled Quarterly Investor Meeting With Management
- Arthur J. Gallagher & Co. Acquires Simply-Communicate Ltd
- Arthur J. Gallagher & Co. Acquires The John Galt Insurance Agency
- Arthur J. Gallagher & Co. Acquires FarmPLUS Insurance Services
- Arthur J. Gallagher & Co. Acquires Ericson Insurance Advisors
About author
Online


Add a comment
Comments
0 comments on the analysis ARTHUR J. GALLAGHER & CO. - 1H