NASDAQ US 500 LARGE CAP GROWTH INDEX - Inflation affecting the US500 - 10/14/2023 (GMT)
- Who voted?
- 111
- 0
- Timeframe : Daily
NASDAQ US 500 LARGE CAP GROWTH INDEX Chart
Are you looking for opportunities in indices and forex?
DISCOVER LONDINIA OPPORTUNITIES...
DISCOVER LONDINIA OPPORTUNITIES...
US stock futures initially rose but then pared gains after the CPI report showed slightly higher than expected inflation. The CPI increased by 0.4% last month, lower than August but more than market consensus. The core index increased by 0.3%, in line with expectations. Despite this, investors still hope that interest rates won't be raised in November, based on dovish comments from Federal Reserve officials and FOMC minutes.
‘Ford Motor's stock fell over 2% due to a strike at its largest plant, while Domino's Pizza tumbled nearly 4% and Delta Air Lines rose over 2% on earnings results. With more earnings of major companies coming up in the next weeks it is only reasonable to expect some kind of sparked volatility for the index’ said Antreas Themistokleous, market analyst at Exness.
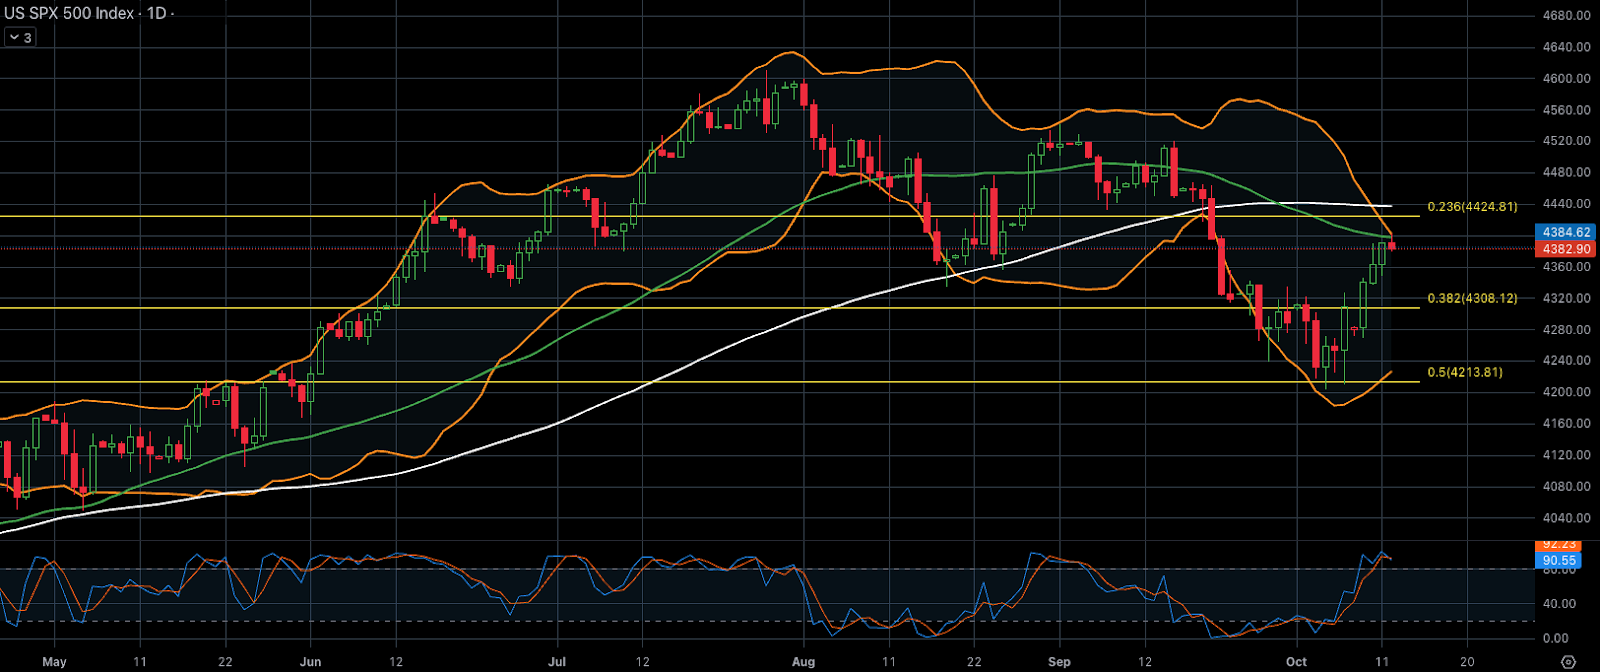
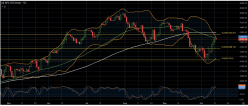
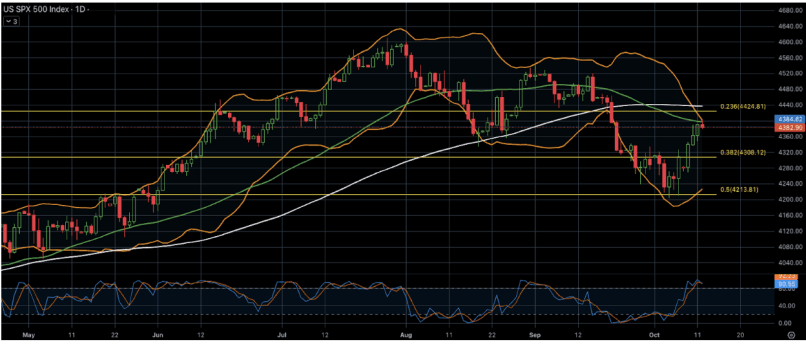
On the technical point of view the level of the index is on its way to gain back on the recent decline chopping off around 300 point and is currently testing a major technical resistance on the daily chart where the 50 day moving average and the upper band of the Bolllinger bands coexist and is also just below the 23.6% of the weekly Fibonacci retracement level. If it is to continue moving to the upside we might see the next level of resistance laying around the 4,440 area which consists of the area between the 100 day moving average and the 23.6% of the weekly Fibonacci level.
‘Ford Motor's stock fell over 2% due to a strike at its largest plant, while Domino's Pizza tumbled nearly 4% and Delta Air Lines rose over 2% on earnings results. With more earnings of major companies coming up in the next weeks it is only reasonable to expect some kind of sparked volatility for the index’ said Antreas Themistokleous, market analyst at Exness.
On the technical point of view the level of the index is on its way to gain back on the recent decline chopping off around 300 point and is currently testing a major technical resistance on the daily chart where the 50 day moving average and the upper band of the Bolllinger bands coexist and is also just below the 23.6% of the weekly Fibonacci retracement level. If it is to continue moving to the upside we might see the next level of resistance laying around the 4,440 area which consists of the area between the 100 day moving average and the 23.6% of the weekly Fibonacci level.
This member declared not having a position on this financial instrument or a related financial instrument.
About author

Offline


Add a comment
Comments
0 comments on the analysis NASDAQ US 500 LARGE CAP GROWTH INDEX - Daily