DIVDAX PR - 1H - Technical analysis published on 06/07/2023 (GMT)
- 100
- 0
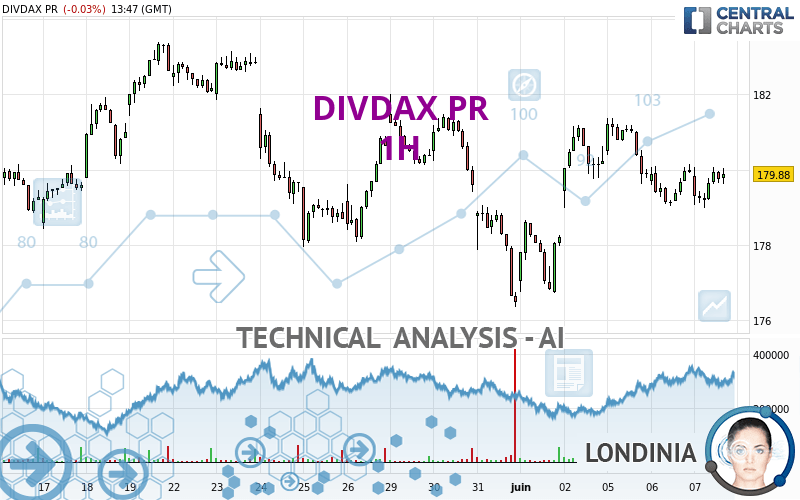
- Timeframe : 1H
- - Analysis generated on
- Status : NEUTRAL

Summary of the analysis

Additional analysis
Quotes
The DIVDAX PR rating is 179.88 EUR. The price is lower by -0.03% since the last closing and was traded between 178.98 EUR and 180.08 EUR over the period. The price is currently at +0.50% from its lowest and -0.11% from its highest.The Central Gaps scanner detects a bearish opening. A small advantage for sellers in the very short term.
Bearish opening
Type : Bearish
Timeframe : Openning
Here is a more detailed summary of the historical variations registered by DIVDAX PR:
Near a new HIGH record (1 year)
Type : Bullish
Timeframe : Weekly
Near a new HIGH record (1st january)
Type : Bullish
Timeframe : Weekly
Near a new HIGH record (1 month)
Type : Bullish
Timeframe : Weekly
Technical
Technical analysis of this 1H chart of DIVDAX PR indicates that the overall trend is slightly bearish. 53.57% of the signals given by moving averages are bearish. Caution: the slightly bullish signals currently given by short-term moving averages could cause a reversal of the trend. The Central Indicators scanner detects bullish signals on moving averages that could impact this trend:
Bullish price crossover with Moving Average 20
Type : Bullish
Timeframe : 1 hour
Bullish price crossover with Moving Average 100
Type : Bullish
Timeframe : 1 hour
Bullish price crossover with adaptative moving average 100
Type : Bullish
Timeframe : 1 hour
In fact, 10 technical indicators on 18 studied are currently positioned bullish. Central Indicators, the detector scanner for these technical indicators has recently detected several signals:
RSI indicator is back under 50
Type : Bearish
Timeframe : 1 hour
MACD crosses UP its Moving Average
Type : Bullish
Timeframe : 1 hour
Price is back under the pivot point
Type : Bearish
Timeframe : 1 hour
The analysis of the price chart with Central Patterns scanners does not return any result.
The presence of these Japanese chandelier patterns detected by Central Candlesticks that could impact the current short-term trend were also noted:
Bullish harami
Type : Bullish
Timeframe : 1 hour
Black hanging man / hammer
Type : Neutral
Timeframe : 1 hour
| S3 | S2 | S1 | Price | R1 | R2 | R3 | |
|---|---|---|---|---|---|---|---|
| ProTrendLines | 176.04 | 177.93 | 179.07 | 179.88 | 180.14 | 181.42 | 182.83 |
| Change (%) | -2.13% | -1.08% | -0.45% | - | +0.14% | +0.86% | +1.64% |
| Change | -3.84 | -1.95 | -0.81 | - | +0.26 | +1.54 | +2.95 |
| Level | Major | Intermediate | Minor | - | Minor | Intermediate | Intermediate |
Pivot points can also be used to set your price objectives. Here is the price situation in relation to pivot points:
| Pivot points | S3 | S2 | S1 | PP | R1 | R2 | R3 |
|---|---|---|---|---|---|---|---|
| Standard | 178.14 | 178.58 | 179.26 | 179.70 | 180.38 | 180.82 | 181.50 |
| Camarilla | 179.62 | 179.73 | 179.83 | 179.93 | 180.03 | 180.14 | 180.24 |
| Woodie | 178.25 | 178.64 | 179.37 | 179.76 | 180.49 | 180.88 | 181.61 |
| Fibonacci | 178.58 | 179.01 | 179.28 | 179.70 | 180.13 | 180.40 | 180.82 |
| Pivot points | S3 | S2 | S1 | PP | R1 | R2 | R3 |
|---|---|---|---|---|---|---|---|
| Standard | 171.40 | 173.87 | 177.06 | 179.53 | 182.72 | 185.19 | 188.38 |
| Camarilla | 178.68 | 179.20 | 179.72 | 180.24 | 180.76 | 181.28 | 181.80 |
| Woodie | 171.75 | 174.05 | 177.41 | 179.71 | 183.07 | 185.37 | 188.73 |
| Fibonacci | 173.87 | 176.04 | 177.37 | 179.53 | 181.70 | 183.03 | 185.19 |
| Pivot points | S3 | S2 | S1 | PP | R1 | R2 | R3 |
|---|---|---|---|---|---|---|---|
| Standard | 163.20 | 169.78 | 173.12 | 179.70 | 183.04 | 189.62 | 192.96 |
| Camarilla | 173.74 | 174.65 | 175.56 | 176.47 | 177.38 | 178.29 | 179.20 |
| Woodie | 161.59 | 168.97 | 171.51 | 178.89 | 181.43 | 188.81 | 191.35 |
| Fibonacci | 169.78 | 173.57 | 175.91 | 179.70 | 183.49 | 185.83 | 189.62 |
Numerical data
The following is the status of the technical indicators and moving averages at the time of publication of this technical analysis:
| RSI (14): | 49.94 | |
| MACD (12,26,9): | -0.0500 | |
| Directional Movement: | -0.50 | |
| AROON (14): | -21.43 | |
| DEMA (21): | 179.67 | |
| Parabolic SAR (0,02-0,02-0,2): | 179.02 | |
| Elder Ray (13): | 0.02 | |
| Super Trend (3,10): | 180.61 | |
| Zig ZAG (10): | 179.79 | |
| VORTEX (21): | 0.8700 | |
| Stochastique (14,3,5): | 71.79 | |
| TEMA (21): | 179.58 | |
| Williams %R (14): | -30.77 | |
| Chande Momentum Oscillator (20): | 0.65 | |
| Repulse (5,40,3): | 0.1200 | |
| ROCnROLL: | 1 | |
| TRIX (15,9): | 0.0000 | |
| Courbe Coppock: | 0.26 |
| MA7: | 179.16 | |
| MA20: | 180.09 | |
| MA50: | 182.72 | |
| MA100: | 182.80 | |
| MAexp7: | 179.68 | |
| MAexp20: | 179.71 | |
| MAexp50: | 179.73 | |
| MAexp100: | 180.00 | |
| Price / MA7: | +0.40% | |
| Price / MA20: | -0.12% | |
| Price / MA50: | -1.55% | |
| Price / MA100: | -1.60% | |
| Price / MAexp7: | +0.11% | |
| Price / MAexp20: | +0.09% | |
| Price / MAexp50: | +0.08% | |
| Price / MAexp100: | -0.07% |
About author
Online


Add a comment
Comments
0 comments on the analysis DIVDAX PR - 1H